策略概述
BabyShark VWAP交易策略是一种基于成交量加权平均价(VWAP)和能量潮指标相对强弱指数(OBV RSI)的量化交易策略。该策略旨在根据价格偏离VWAP的程度以及OBV RSI突破特定阈值来识别潜在的买入和卖出信号。
策略原理
该策略的核心原理是利用VWAP和OBV RSI两个指标来捕捉市场的趋势和动量变化。VWAP是一种基于价格和成交量的动态均线,能够反映市场的主要交易区域。当价格显著偏离VWAP时,通常意味着市场出现了超买或超卖的情况。而OBV RSI则是在传统RSI指标的基础上引入了成交量因素,通过测量成交量变化的强度来判断市场趋势的稳健程度。
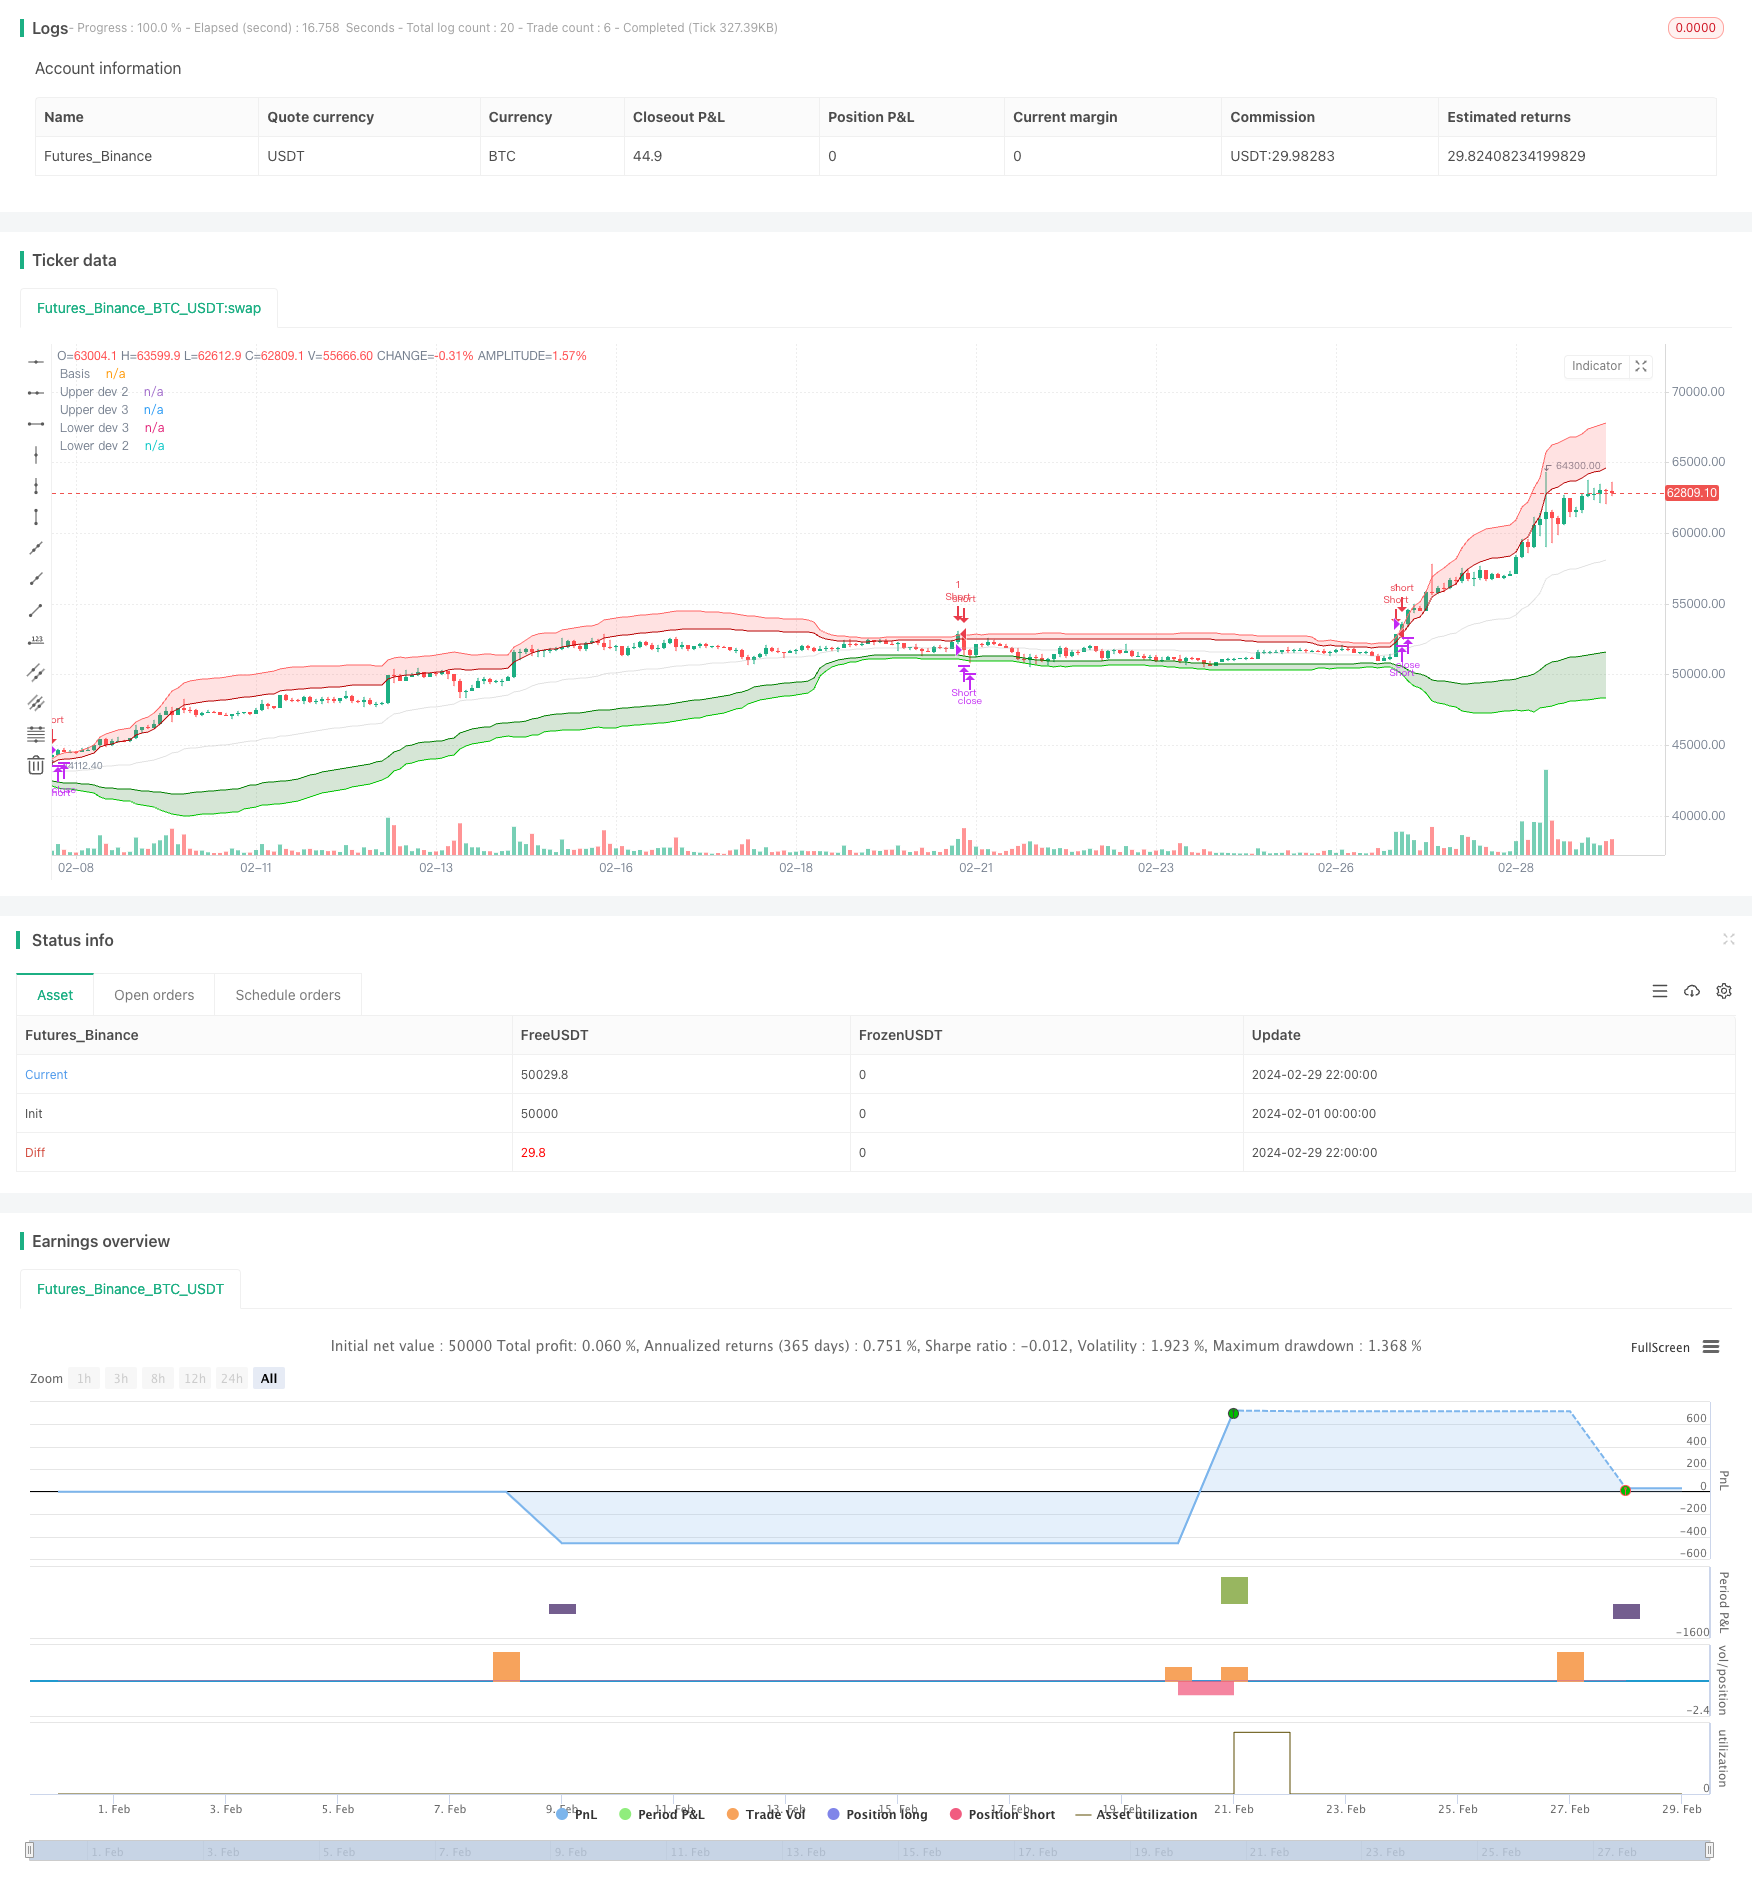
具体来说,该策略使用60根K线作为VWAP的计算周期,并以收盘价作为输入数据。然后根据价格偏离VWAP正负3个标准差的区间来构建超买和超卖区。对于OBV RSI,则是使用5根K线作为计算周期,并设置了70和30两个阈值作为超买和超卖的判断标准。
在交易逻辑方面,当价格处于VWAP下轨的超卖区且OBV RSI小于30时,策略会发出做多信号;而当价格处于VWAP上轨的超买区且OBV RSI大于70时,则会发出做空信号。同时,策略还设置了0.6%的止盈止损比例,并在连续亏损后引入10根K线的冷静期来控制风险。
策略优势
- 结合价格和成交量等多个市场要素,全面捕捉市场趋势和动量。
- 采用动态VWAP和OBV RSI指标,能够适应不同市场周期的变化。
- 设置合理的止盈止损比例和冷静期,在把握机会的同时有效控制风险。
- 逻辑清晰,易于理解和实现,且具有一定的可解释性。
- 参数可调,适合不同风格的交易者进行优化和改进。
策略风险
- 对于震荡市或行情反复时,频繁的交易信号可能导致过度交易和滑点成本增加。
- 在趋势行情中,单纯依赖VWAP进行止盈可能导致策略过早离场,错失后续趋势利润。
- 固定的参数设置可能无法适应市场环境的变化,需要针对不同品种和周期进行优化。
- OBV指标对于成交量的依赖性较强,在成交量数据不真实或受到操纵时,指标失真可能误导判断。
- 策略缺乏对宏观经济、消息面等外部因素的考虑,面对极端行情可能失效。
优化方向
- 针对震荡市引入更多过滤条件,如趋势确认指标、波动率指标等,减少频繁交易。
- 优化离场条件,如采用移动止盈或结合其他趋势跟踪指标,更好地把握趋势行情。
- 对VWAP和OBV RSI的参数进行自适应优化,动态调整计算周期和阈值设置。
- 引入成交量真实性检验机制,提高OBV RSI指标的可靠性。
- 考虑加入宏观经济数据分析、情绪指标等,增强策略的适应性和稳健性。
总结
BabyShark VWAP交易策略是一种融合了成交量加权平均价和能量潮指标相对强弱指数的量化交易策略,通过捕捉市场的超买超卖状态和趋势动量变化来产生交易信号。该策略逻辑清晰,结合了价格和成交量等多个市场要素,能够全面把握市场脉搏。同时,合理的止盈止损设置和风险控制机制,使得策略在追求收益的同时兼顾了风险管理。当然,策略也存在对震荡市和趋势行情的适应性不足,以及参数固定等潜在问题。未来可以从优化入场过滤、动态止盈、参数自适应、增强外部数据分析等方面进一步完善和提升策略的稳健性和盈利能力。总的来说,BabyShark VWAP交易策略为量化交易实践提供了一种可供参考的思路和框架,值得进一步探索和改进。
/*backtest
start: 2024-02-01 00:00:00
end: 2024-02-29 23:59:59
period: 2h
basePeriod: 15m
exchanges: [{"eid":"Futures_Binance","currency":"BTC_USDT"}]
*/

// This Pine Script™ code is subject to the terms of the Mozilla Public License 2.0 at https://mozilla.org/MPL/2.0/
// © GreatestUsername

//@version=5
strategy("BabyShark VWAP Strategy", overlay=true, margin_long=100, margin_short=100, calc_on_every_tick = true)


// VWAP
ls = input(false, title='Log-space', group = "Optional")
type = 'Average Deviation'
length = input(60, group="Strategy Modification")
source = input(close, group="Strategy Modification")
_low = ls == true ? math.log(low) : low
_high = ls == true ? math.log(high) : high
src = ls == true ? math.log(source) : source

//weighted mean
pine_vwmean(x, y) =>
    cw = 0.0
    cd = 0.0
    w_sum = 0.0
    d_sum = 0.0
    for i = 0 to y - 1 by 1
        cd := x[i]
        cw := volume[i]
        d_sum += cw * cd
        w_sum += cw
        w_sum
    d_sum / w_sum

//weighted standard deviation
pine_vwstdev(x, y, b) =>
    d_sum = 0.0
    w_sum = 0.0
    cd = 0.0
    for i = 0 to y - 1 by 1
        cd := x[i]
        cw = volume[i]
        d_sum += cw * math.pow(cd - b, 2)
        w_sum += cw
        w_sum
    math.sqrt(d_sum / w_sum)

//weighted average deviation
pine_vwavdev(x, y, b) =>
    d_sum = 0.0
    w_sum = 0.0
    cd = 0.0
    for i = 0 to y - 1 by 1
        cd := x[i]
        cw = volume[i]
        d_sum += cw * math.abs(cd - b)
        w_sum += cw
        w_sum
    d_sum / w_sum

vwmean = pine_vwmean(src, length)

//consider using Average Deviation instead of Standard Deviatio if there are values outside of 3rd upper & lower bands within a rolling window
dev = if type == 'Standard Deviation'
    dev = pine_vwstdev(src, length, vwmean)
    dev
else if type == 'Average Deviation'
    dev = pine_vwavdev(src, length, vwmean)
    dev

basis = ls == true ? math.exp(vwmean) : vwmean
plot(basis, color=color.new(#b7b7b7, 60), title='Basis')

upper_dev_2 = vwmean + dev * 2
upper_dev_3 = vwmean + dev * 3

lower_dev_2 = vwmean - dev * 2
lower_dev_3 = vwmean - dev * 3

fill(
     plot1=plot(ls == true ? math.exp(upper_dev_2) : upper_dev_2, color=color.new(#B20000, 0), title='Upper dev 2'),
     plot2=plot(ls == true ? math.exp(upper_dev_3) : upper_dev_3, color=color.new(#FF6666, 0), title='Upper dev 3', display=display.none),
     color=color.new(#FF4D4D, 80), title='Upper band'
     )
fill(
     plot1=plot(ls == true ? math.exp(lower_dev_3) : lower_dev_3, color=color.new(#00CC00, 0), title='Lower dev 3', display=display.none),
     plot2=plot(ls == true ? math.exp(lower_dev_2) : lower_dev_2, color=color.new(#008000, 0), title='Lower dev 2'),
     color=color.new(#006600, 80), title='Lower band'
     )


// Input to enable or disable the table visibility
table_visible = input(false, title="Show Table", group="Deviation Cross Monitor")
// Input for the number of candles to look back
table_length = input(300, title="Table Lookback Length", group="Deviation Cross Monitor")

// Custom count function
count_occurrences(cond, length) =>
    count = 0
    for i = 0 to length - 1
        if cond[i]
            count := count + 1
    count

// Count occurrences of prices above Upper dev 2 and below Lower dev 2

above_upper_dev_2 = count_occurrences(close > upper_dev_2, table_length)
below_lower_dev_2 = count_occurrences(close < lower_dev_2, table_length)

// Create table in the bottom right corner
var table tbl = table.new(position=position.bottom_right, rows=2, columns=2)

if table_visible
    if barstate.islast
        // Update the table headers
        table.cell(tbl, 0, 0, "Above Upper Dev 2", bgcolor=color.gray, text_color=color.white)
        table.cell(tbl, 0, 1, "Below Lower Dev 2", bgcolor=color.gray, text_color=color.white)

        // Update the table values
        table.cell(tbl, 1, 0, str.tostring(above_upper_dev_2), bgcolor=color.new(color.green, 90), text_color=color.green)
        table.cell(tbl, 1, 1, str.tostring(below_lower_dev_2), bgcolor=color.new(color.red, 90), text_color=color.red)
else
    table.delete(tbl)

// RSI
obvsrc = close
change_1 = ta.change(obvsrc)
obv = ta.cum(ta.change(obvsrc) > 0 ? volume : change_1 < 0 ? -volume : 0 * volume)

src2 = obv
len = input.int(5, minval=1, title="RSI Length", group="Strategy Modification")
up = ta.rma(math.max(ta.change(src2), 0), len)
down = ta.rma(-math.min(ta.change(src2), 0), len)
rsi = down == 0 ? 100 : up == 0 ? 0 : 100 - 100 / (1 + up / down)
higherlvl = input(70, title="Higher Level", group="Strategy Modification")
lowerlvl = input(30, title="Lower Level", group="Strategy Modification")


plot_color = rsi >= higherlvl ? color.red : rsi <= lowerlvl ? color.green : color.new(#b7b7b7, 60)
// plot(rsi, color=plot_color)

//plot(rsi, color=color.white)


// Count occurrences of RSI crossing higher level and lower level
cross_above_higher = ta.crossover(rsi, higherlvl)
cross_below_lower = ta.crossunder(rsi, lowerlvl)
above_higher_count = count_occurrences(cross_above_higher, table_length)
below_lower_count = count_occurrences(cross_below_lower, table_length)

// Create table in the bottom right corner
if (table_visible)
    var table tbl2 = table.new(position=position.bottom_right, rows=2, columns=2)
    if (barstate.islast)
        // Update the table headers
        table.cell(tbl2, 0, 0, "Higher Level Cross", bgcolor=color.gray, text_color=color.white)
        table.cell(tbl2, 0, 1, "Lower Level Cross", bgcolor=color.gray, text_color=color.white)

        // Update the table values
        table.cell(tbl2, 1, 0, str.tostring(above_higher_count), bgcolor=color.new(color.red, 90), text_color=color.red)
        table.cell(tbl2, 1, 1, str.tostring(below_lower_count), bgcolor=color.new(color.green, 90), text_color=color.green)


// Entries

// Long Entry:
// Price is in the shaded GREEN area of [Hoss] VWAP Deviation
// and the [Hoss] OBV RSI is GREEN.
longCondition1 = close <= lower_dev_3
longConditions = plot_color == color.green and longCondition1 and strategy.position_size == 0

// Short Entry:
// Price is in the shaded RED area of [Hoss] VWAP Deviation
// and the [Hoss] OBV RSI is RED.
shortCondition1 = close >= upper_dev_3
shortConditions = plot_color == color.red and shortCondition1 and strategy.position_size == 0

var int lastEntryBar = 0


shortEMA = ta.ema(close, 12)
longEMA = ta.ema(close, 21)
uptrend = shortEMA > longEMA

if longConditions and lastEntryBar < bar_index - 10 //and uptrend
    strategy.entry("Long", strategy.long, stop=close * 0.994)
    lastEntryBar := bar_index

if shortConditions and lastEntryBar < bar_index - 10 //and not uptrend
    strategy.entry("Short", strategy.short, stop=close * 1.006)
    lastEntryBar := bar_index


if strategy.position_size > 0 and (ta.crossover(close, basis) or strategy.opentrades.entry_price(strategy.opentrades - 1) * 0.994 > close)
    strategy.close("Long", immediately = true)
if strategy.position_size < 0 and (ta.crossunder(close, basis) or strategy.opentrades.entry_price(strategy.opentrades - 1) * 1.006 < close)
    strategy.close("Short", immediately = true)

// Stop Loss:
// 0.6%
// After 1 Loss => NO more Trades for 10 Candles (10 minutes) (usually a breakout will happen, and it takes average 10min till it ranges again. So basically wait for range to form again)

// Take Profit:
// Grey line on [Hoss] VWAP Deviation or 0.6%