概述
基于价格波动范围的买卖信号过滤策略(Range Filter Buy Sell Signals Strategy)是一个非常实用的量化交易策略。它利用价格的波动范围来过滤买入和卖出信号,在低波动市场中减少假信号,在高波动市场中提高信号质量。这个策略名称准确地概括了策略的主要功能。
策略原理
该策略首先计算资产价格在一个特定周期内的波动范围。具体来说,它计算指定周期内的最高价与最低价之间的差价,来确定价格波动的幅度。
之后,它会生成买入和卖出信号。但是并不是所有的信号都会触发入场,而是需要满足价格波动范围过滤条件。例如,只有当价格突破波动范围时才会发出买入信号。
通过这种方式,该策略在低波动的市场环境中能过滤掉大多数假信号,避免无谓的入场。而在高波动时,它能捕捉较大方向性移动,从中获利。
策略优势
这个策略最大的优势在于能动态调整对信号的过滤强度。在低波动时,它只选择高质量信号;而在高波动时,它能抓住市场提供的更多机会。
相比固定参数的过滤器,这个策略更加智能和适应性强。无论市场处于何种状态,它都能提供较优的风险回报。
此外,相比单一操作条件,这个策略融合了趋势方向判断,能提供更可靠的交易信号。与此同时,它还具备止损止盈功能,能有效控制个别交易的风险。
策略风险
该策略主要的风险在于波动范围参数设定。如果设定的范围过大或过小,都会对信号质量和获利机会产生不利影响。
此外,短期内价格震荡趋势较强的市场中,该策略的获利机会会相对较少。采用不同周期系统的组合有助于缓解这个问题。
策略优化方向
该策略可以通过以下几个方面进行优化:
利用自适应参数算法自动优化波动范围参数,使之更加智能和动态。
增加基于大周期趋势的过滤规则,避免震荡市中被套。
结合不同周期的该策略,形成系统,提高整体的稳定性。
添加机器学习算法,提高参数设置和过滤规则的效果。
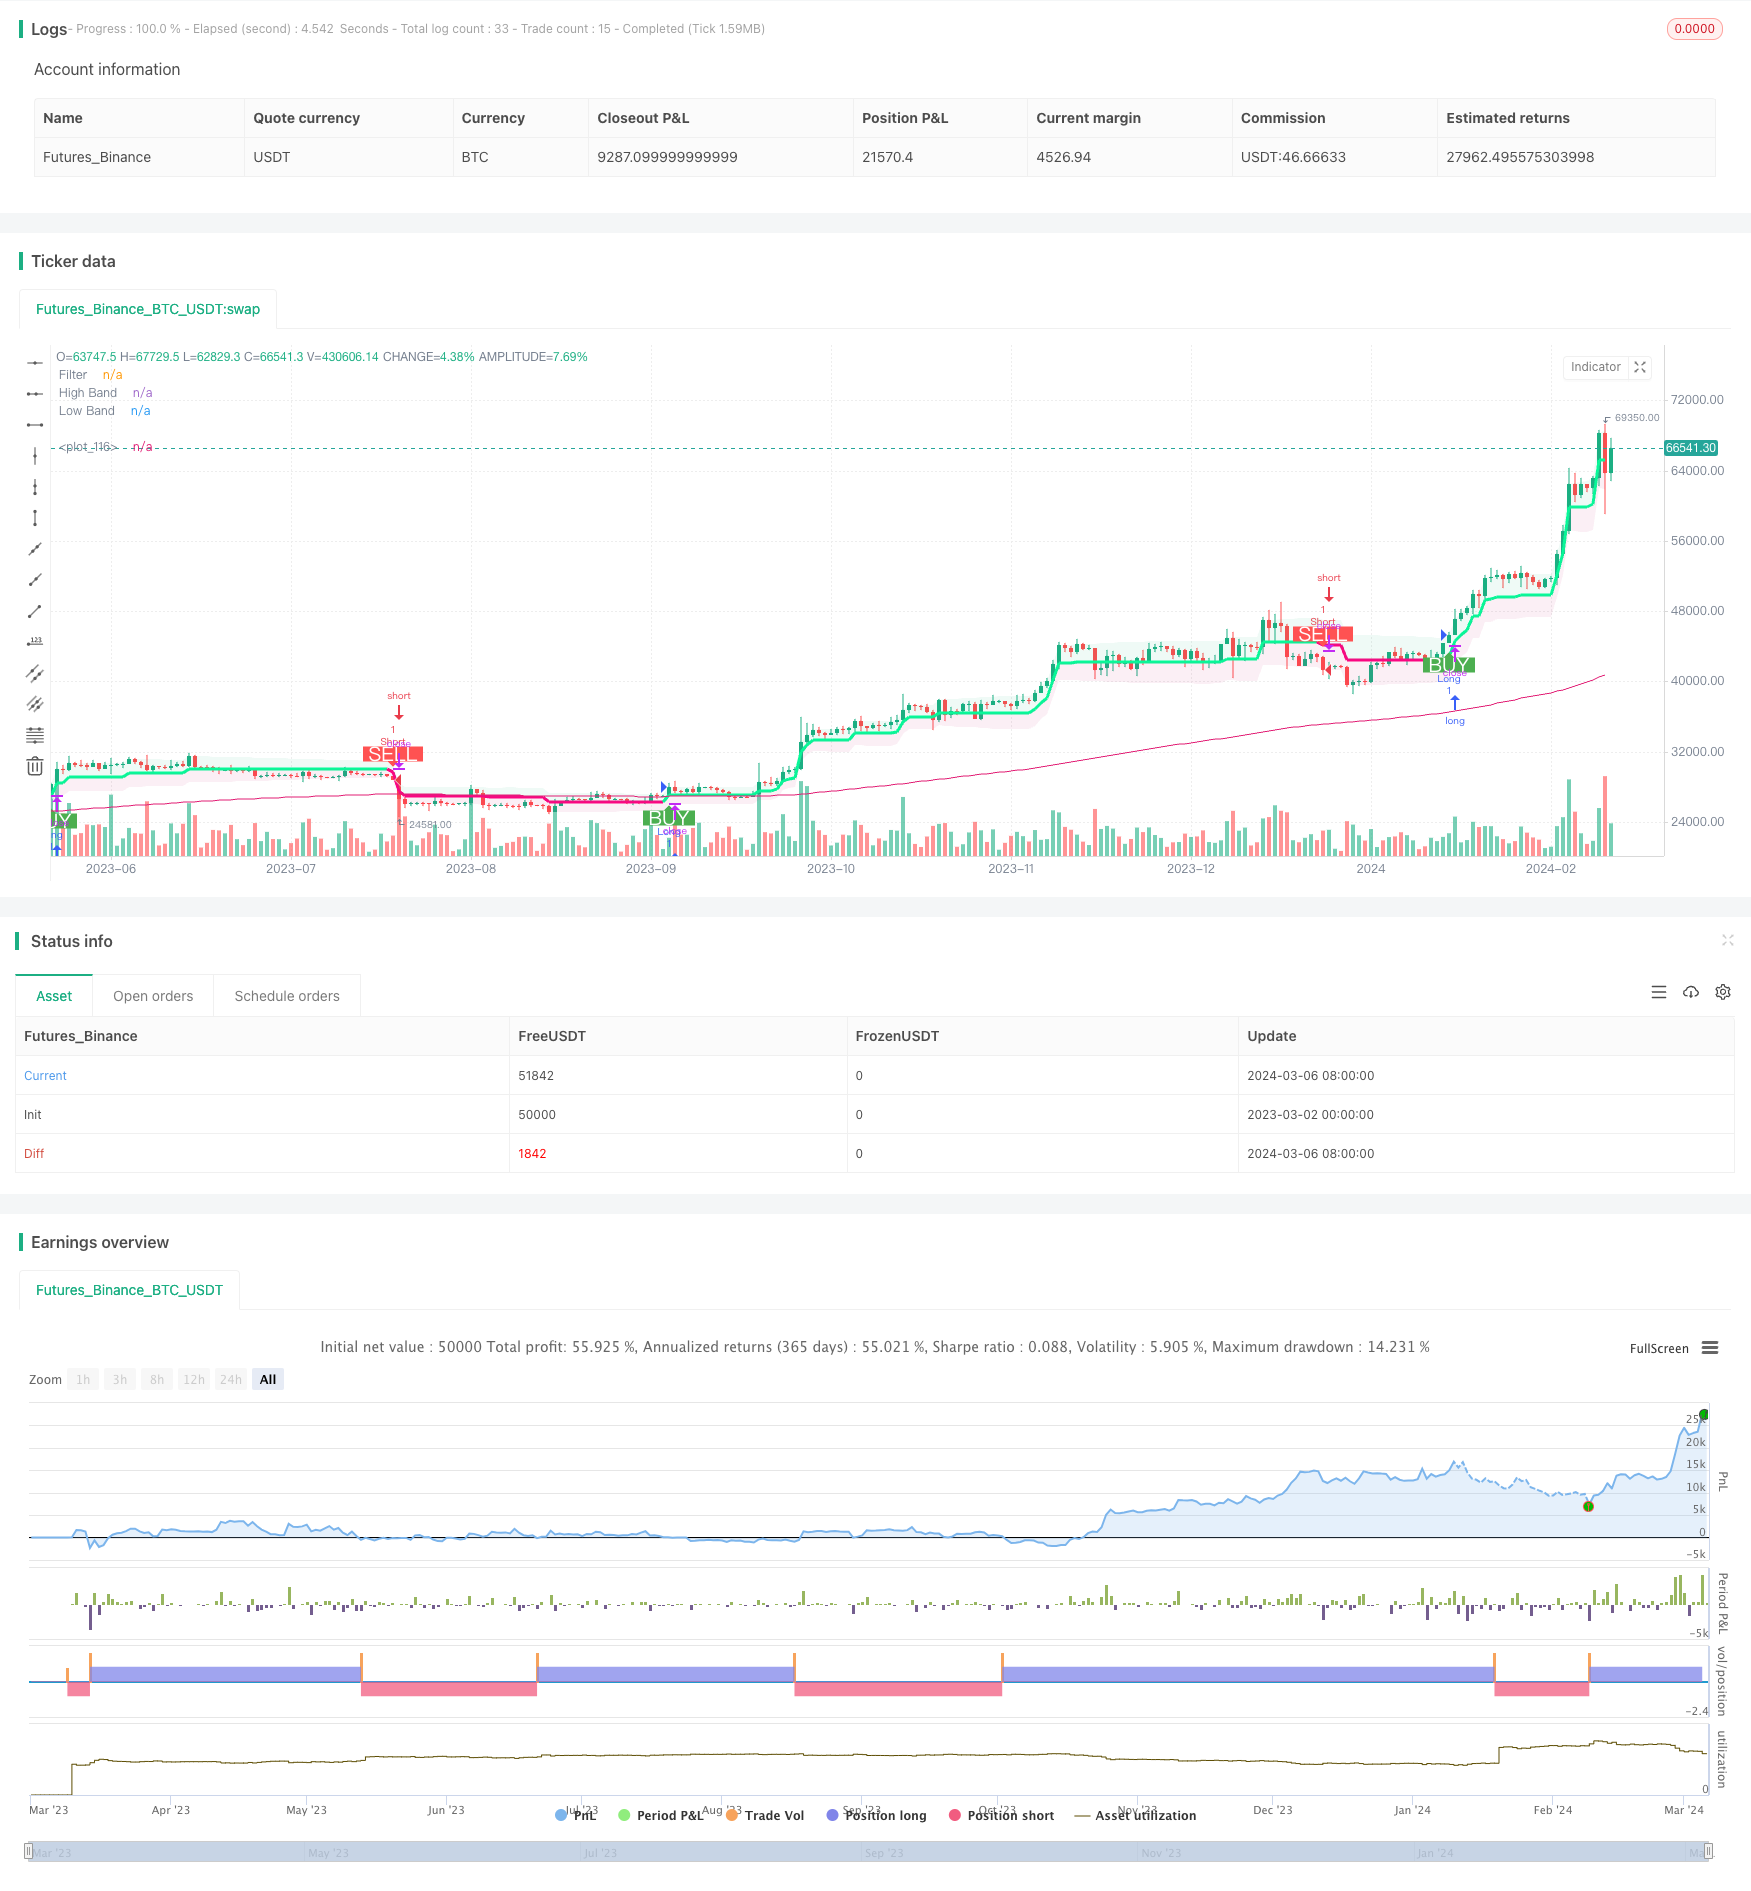
总结
基于价格波动范围的买卖信号过滤策略是一个非常实用和有效的量化交易策略。它能动态调整过滤强度,在不同市场环境中都能提供较优的风险回报。与此同时,该策略还有很大的优化空间,特别是参数优化和规则优化方面。总的来说,这个策略为追求稳定超额收益的量化交易者提供了一个非常好的基础解决方案。
/*backtest
start: 2023-03-02 00:00:00
end: 2024-03-07 00:00:00
period: 1d
basePeriod: 1h
exchanges: [{"eid":"Futures_Binance","currency":"BTC_USDT"}]
*/

// This source code is subject to the terms of the Mozilla Public License 2.0 at https://mozilla.org/MPL/2.0/

// Credits to the original Script - Range Filter DonovanWall https://www.tradingview.com/script/lut7sBgG-Range-Filter-DW/
// This version is the old version of the Range Filter with less settings to tinker with

//@version=5
strategy(title='Range Filter - B&S Signals', shorttitle='[Doan]_RF-B&S Signals', overlay=true)

//-----------------------------------------------------------------------------------------------------------------------------------------------------------------
//Functions
//-----------------------------------------------------------------------------------------------------------------------------------------------------------------
longLossPerc = input.float(title='Long Stop Loss (%)', minval=0.0, step=0.1, defval=1) * 0.01
shortLossPerc = input.float(title='Short Stop Loss (%)', minval=0.0, step=0.1, defval=1) * 0.01

longTakePerc = input.float(title='Long Take(%)', minval=0.0, step=0.1, defval=1) * 0.01
shortTakePerc = input.float(title='Short Take (%)', minval=0.0, step=0.1, defval=1) * 0.01

emaLength = input.int(200, title="EMA Length")

// Determine stop loss price

//Range Size Function
rng_size(x, qty, n) =>
    wper = n * 2 - 1
    avrng = ta.ema(math.abs(x - x[1]), n)
    AC = ta.ema(avrng, wper) * qty
    rng_size = AC

//Range Filter Function
rng_filt(x, rng_, n) =>
    r = rng_
    var rfilt = array.new_float(2, x)
    array.set(rfilt, 1, array.get(rfilt, 0))
    if x - r > array.get(rfilt, 1)
        array.set(rfilt, 0, x - r)
    if x + r < array.get(rfilt, 1)
        array.set(rfilt, 0, x + r)
    rng_filt1 = array.get(rfilt, 0)

    hi_band = rng_filt1 + r
    lo_band = rng_filt1 - r
    rng_filt = rng_filt1
    [hi_band, lo_band, rng_filt]

//-----------------------------------------------------------------------------------------------------------------------------------------------------------------
//Inputs
//-----------------------------------------------------------------------------------------------------------------------------------------------------------------

//Range Source
rng_src = input(defval=close, title='Swing Source')

//Range Period
rng_per = input.int(defval=20, minval=1, title='Swing Period')

//Range Size Inputs
rng_qty = input.float(defval=3.5, minval=0.0000001, title='Swing Multiplier')

//Bar Colors
use_barcolor = input(defval=false, title='Bar Colors On/Off')

//-----------------------------------------------------------------------------------------------------------------------------------------------------------------
//Definitions
//-----------------------------------------------------------------------------------------------------------------------------------------------------------------

//Range Filter Values
[h_band, l_band, filt] = rng_filt(rng_src, rng_size(rng_src, rng_qty, rng_per), rng_per)

//Direction Conditions
var fdir = 0.0
fdir := filt > filt[1] ? 1 : filt < filt[1] ? -1 : fdir
upward = fdir == 1 ? 1 : 0
downward = fdir == -1 ? 1 : 0

//Trading Condition
longCond = rng_src > filt and rng_src > rng_src[1] and upward > 0 or rng_src > filt and rng_src < rng_src[1] and upward > 0
shortCond = rng_src < filt and rng_src < rng_src[1] and downward > 0 or rng_src < filt and rng_src > rng_src[1] and downward > 0

CondIni = 0
CondIni := longCond ? 1 : shortCond ? -1 : CondIni[1]
longCondition = longCond and CondIni[1] == -1
shortCondition = shortCond and CondIni[1] == 1

//Colors
filt_color = upward ? #05ff9b : downward ? #ff0583 : #cccccc
bar_color = upward and rng_src > filt ? rng_src > rng_src[1] ? #05ff9b : #00b36b : downward and rng_src < filt ? rng_src < rng_src[1] ? #ff0583 : #b8005d : #cccccc


ema = ta.ema(close, emaLength)

//-----------------------------------------------------------------------------------------------------------------------------------------------------------------
//Outputs
//-----------------------------------------------------------------------------------------------------------------------------------------------------------------
longStopPrice = strategy.position_avg_price * (1 - longLossPerc)
shortStopPrice = strategy.position_avg_price * (1 + shortLossPerc)

longTakePrice = strategy.position_avg_price * (1 + longTakePerc)
shortTakePrice = strategy.position_avg_price * (1 - shortTakePerc)

//Filter Plot
filt_plot = plot(filt, color=filt_color, linewidth=3, title='Filter', transp=67)

//Band Plots
h_band_plot = plot(h_band, color=color.new(#05ff9b, 100), title='High Band')
l_band_plot = plot(l_band, color=color.new(#ff0583, 100), title='Low Band')

//Band Fills
fill(h_band_plot, filt_plot, color=color.new(#00b36b, 92), title='High Band Fill')
fill(l_band_plot, filt_plot, color=color.new(#b8005d, 92), title='Low Band Fill')

//Bar Color
barcolor(use_barcolor ? bar_color : na)
// Entry
strategy.entry("Long", strategy.long, when=longCondition)
strategy.entry("Short", strategy.short, when=shortCondition)

plot(ema)

//Plot Buy and Sell Labels
plotshape(longCondition, title='Buy Signal', text='BUY', textcolor=color.white, style=shape.labelup, size=size.normal, location=location.belowbar, color=color.new(color.green, 0))
plotshape(shortCondition, title='Sell Signal', text='SELL', textcolor=color.white, style=shape.labeldown, size=size.normal, location=location.abovebar, color=color.new(color.red, 0))

//Alerts
alertcondition(longCondition, title='Buy Alert', message='BUY')
alertcondition(shortCondition, title='Sell Alert', message='SELL')