A Trading Strategy Based on Dual Moving Average Crossover

Overview
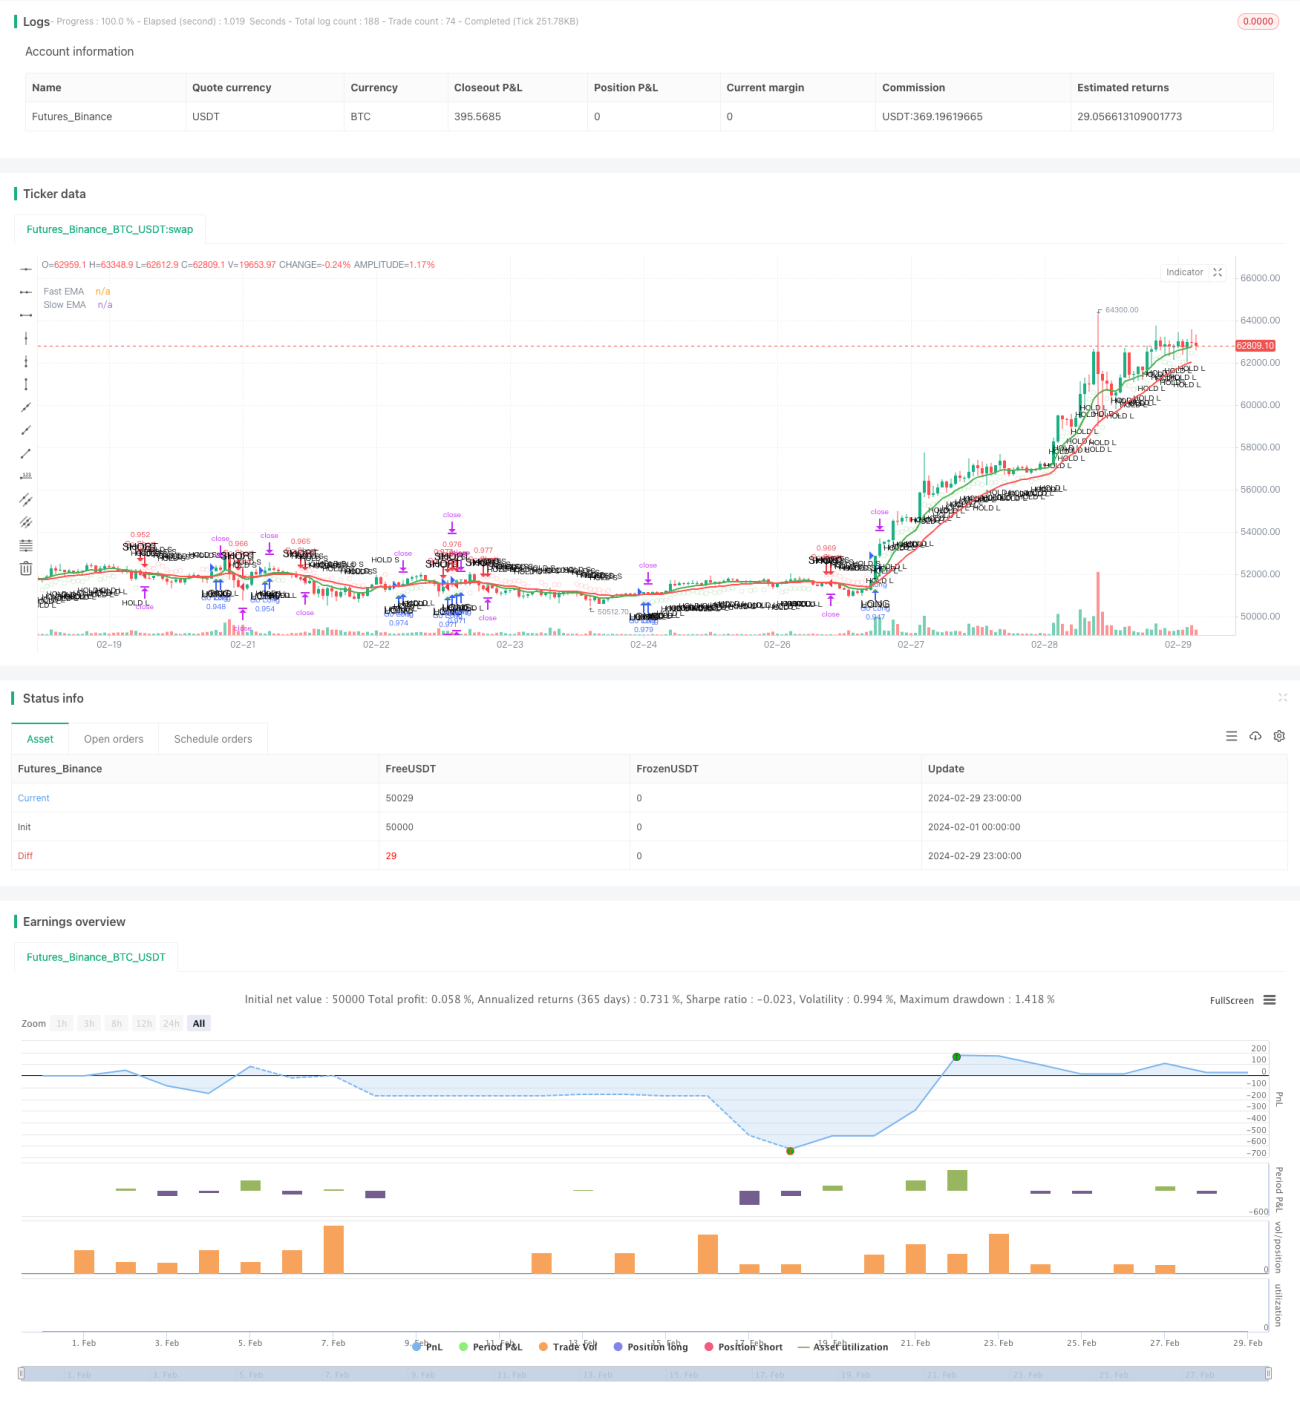
The Momentum Crossover Strategy is a trading strategy based on the crossover of two moving averages. The strategy uses a fast moving average (fast MA) and a slow moving average (slow MA) to capture changes in market momentum. When the fast MA crosses above the slow MA from below, it generates a long signal; when the fast MA crosses below the slow MA from above, it generates a short signal. The strategy also considers trend continuation conditions, stop-loss, and take-profit to control risk and optimize returns.
Strategy Principles
The core principle of this strategy is to use two exponential moving averages (EMAs) with different periods to determine market trends and momentum. The specific steps are as follows:
- Calculate the fast EMA (9 days in this example) and the slow EMA (21 days in this example).
- When the fast EMA crosses above the slow EMA from below, it generates a long signal; conversely, when the fast EMA crosses below the slow EMA from above, it generates a short signal.
- To confirm trend continuation, the strategy also sets holding conditions: for long positions, the fast EMA should be above the slow EMA, and the closing price should be above the fast EMA; for short positions, the fast EMA should be below the slow EMA, and the closing price should be below the fast EMA.
- To control risk, the strategy uses the Average True Range (ATR) to gauge market volatility. When the difference between the fast EMA and the slow EMA is less than the ATR, the strategy avoids opening new positions.
- The strategy also sets stop-loss (1%) and take-profit (2%) levels based on a fixed percentage of the entry price for risk control.
Through these principles, the strategy makes trading decisions based on changes in market trends and momentum while considering factors such as trend continuity, market volatility, and risk control.
Advantage Analysis
The Momentum Crossover Strategy has the following advantages:
- Trend tracking: By using the crossover of fast and slow moving averages, the strategy can promptly capture changes in market trends and adapt to different market environments.
- Simplicity and ease of use: The strategy logic is clear and relies only on price and moving average indicators, making it easy to understand and implement.
- Risk control: The strategy incorporates stop-loss and take-profit levels to control the risk exposure of individual trades based on a fixed percentage.
- Trend confirmation: The strategy not only considers moving average crossovers but also introduces trend continuation conditions to ensure the persistence of the trend when opening positions.
- Volatility filtering: By comparing the difference between moving averages and the ATR, the strategy can avoid opening positions when market volatility is low, reducing trading frequency and risk.
Risk Analysis
Although the Momentum Crossover Strategy has its advantages, it still faces some risks:
- Lag risk: Moving averages are lagging indicators and may generate signals only after a trend reversal, leading to missed optimal entry points or larger drawdowns.
- Sideways market risk: In sideways markets, fast and slow moving averages may frequently cross, generating multiple false signals and resulting in frequent trades and losses.
- Parameter risk: The strategy's performance depends on the settings of moving average periods and stop-loss/take-profit levels, and different parameters may lead to different results.
- Black swan risk: The strategy is based on historical data and may not be able to handle extreme market events or abnormal volatility, leading to significant losses.
To address these risks, the following methods can be considered:
- Combine other indicators or signals, such as price action or trading volume, to improve the reliability of signals.
- Introduce filtering mechanisms in sideways markets, such as ATR or ADX, to avoid frequent trading.
- Optimize and test parameters to select parameter combinations with stable historical performance.
- Set reasonable risk control measures, such as position sizing and overall stop-loss, to handle extreme market conditions.
Optimization Directions
To further enhance the performance of the Momentum Crossover Strategy, the following optimization directions can be considered:
- Dynamic parameter optimization: Dynamically adjust moving average periods and stop-loss/take-profit parameters based on market conditions to adapt to different market rhythms and volatility. This can improve the adaptability and robustness of the strategy.
- Multi-timeframe analysis: Combine moving average signals from different timeframes, such as daily and hourly, to obtain a more comprehensive judgment of trends and allocate positions based on the strength of signals from different timeframes.
- Integrate other technical indicators: Introduce other technical indicators, such as MACD or RSI, to provide additional validation of trading signals and improve signal reliability.
- Risk management optimization: Adopt more advanced risk management methods, such as the Kelly Criterion or dynamic position sizing, to optimize capital allocation and control drawdown risk.
- Machine learning optimization: Apply machine learning algorithms, such as genetic algorithms or neural networks, to optimize strategy parameters and logic, searching for the best parameter combinations and trading rules.
Through these optimization directions, the Momentum Crossover Strategy can enhance adaptability, robustness, and profit potential while maintaining its original advantages, better coping with the challenges of different market environments.
Summary
The Momentum Crossover Strategy is a simple yet effective trading strategy that captures market trends and momentum changes through the crossover of fast and slow moving averages. The strategy has advantages such as trend tracking, simplicity, risk control, and consideration of trend continuity and market volatility. However, it also faces challenges such as lag risk, sideways market risk, parameter risk, and black swan risk. To address these risks and further improve strategy performance, dynamic parameter optimization, multi-timeframe analysis, integration of other technical indicators, risk management optimization, and machine learning optimization can be considered. Through continuous optimization and improvement, the Momentum Crossover Strategy can become a more robust and effective trading tool, helping traders achieve stable returns in various market environments.
/*backtest
start: 2024-02-01 00:00:00
end: 2024-02-29 23:59:59
period: 1h
basePeriod: 15m
exchanges: [{"eid":"Futures_Binance","currency":"BTC_USDT"}]
*/

//@version=4
strategy("Enhanced Momentum Bot", shorttitle="EMB", overlay=true, default_qty_type=strategy.percent_of_equity, default_qty_value=100)

// Define the Exponential Moving Averages (EMA)- 1