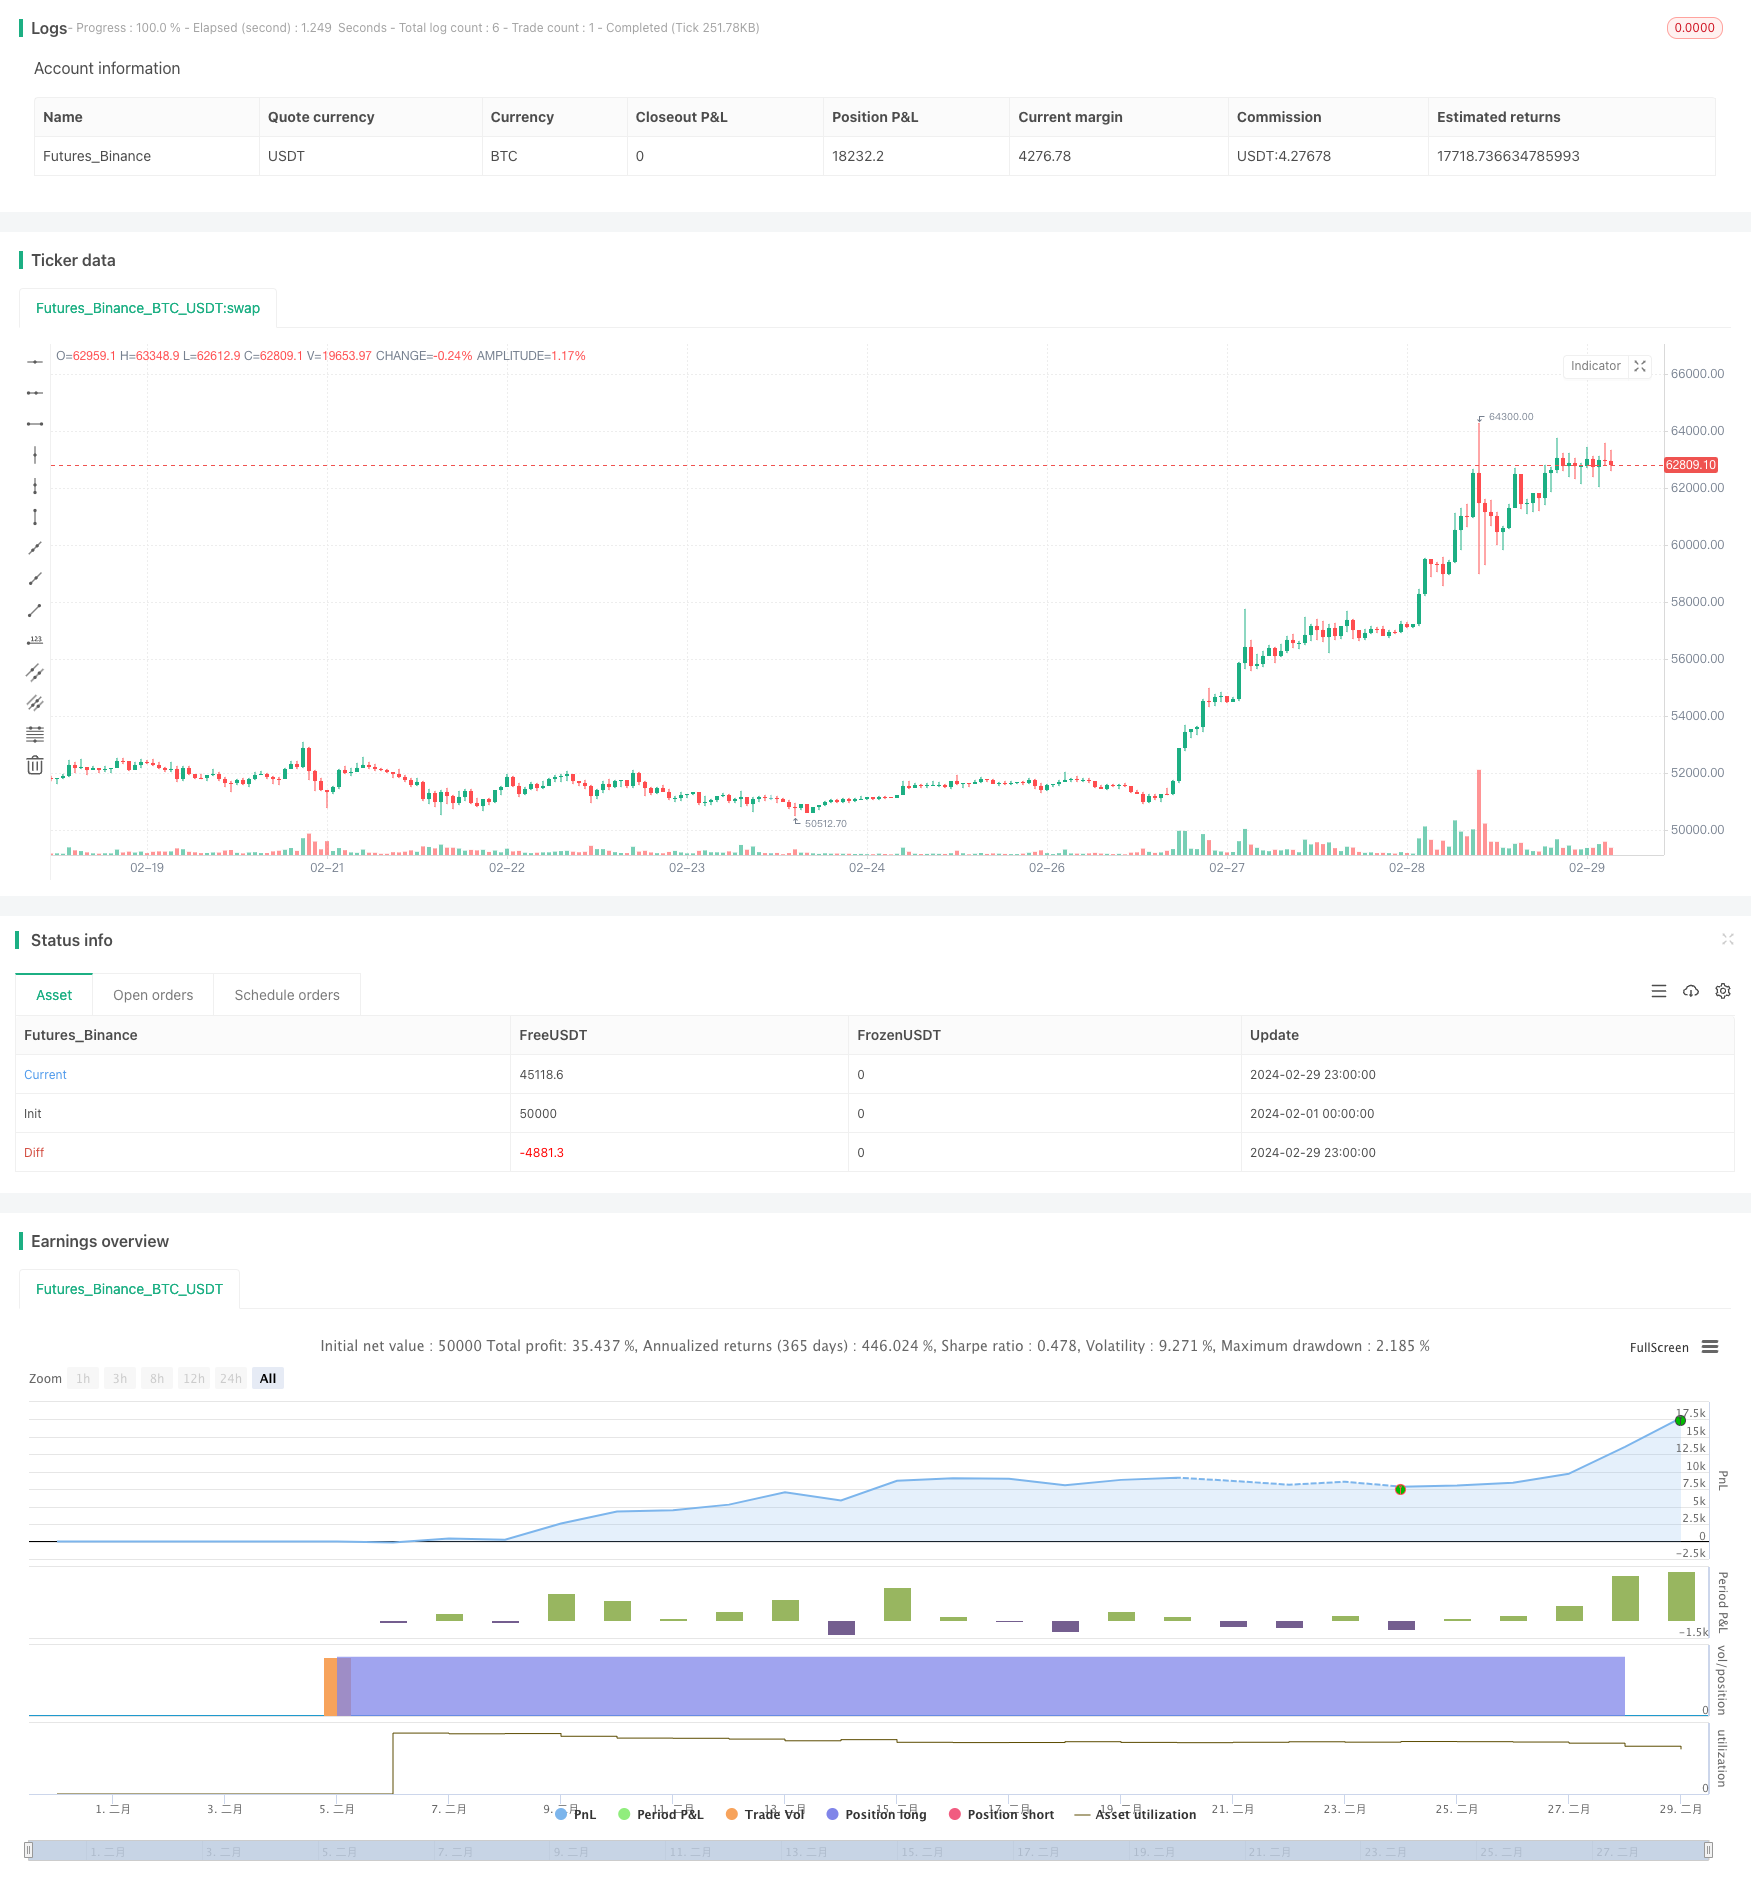
概述
该策略基于MACD、ADX和EMA200指标,通过判断当前市场趋势和动量,在多个时间框架下进行趋势交易。策略的主要思想是利用MACD指标判断市场趋势,ADX指标确认趋势强度,EMA200作为趋势过滤条件,同时采用多个时间框架进行交易,以获取更多的交易机会和更好的收益风险比。
策略原理
- 计算200日指数移动平均线(EMA200),作为趋势过滤条件。
- 计算MACD指标,包括MACD线、信号线和柱状图,用于判断市场趋势。
- 计算真实波动率(ATR)和方向运动指标(ADX),用于确认趋势强度。
- 多头入场条件:收盘价在EMA200上方,MACD线在信号线上方且在0以下,ADX大于等于25。
- 空头入场条件:收盘价在EMA200下方,MACD线在信号线下方且在0以上,ADX大于等于25。
- 使用ATR计算止损和止盈距离,止损设置为1%,止盈设置为1.5%。
- 在多头条件满足时,以停止单和限价单的方式进行做多;在空头条件满足时,以停止单和限价单的方式进行做空。
- 在不同时间框架下测试策略,如15分钟、30分钟、1小时等,找出最优的交易时间框架。
优势分析
- 结合多个指标进行交易决策,有助于提高策略的可靠性和稳定性。
- 采用多时间框架交易,可以捕捉不同级别的趋势,获取更多的交易机会。
- 使用ATR计算止损和止盈距离,可以动态调整仓位,控制风险。
- 止损和止盈设置合理,有助于提高策略的收益风险比。
- 代码结构清晰,易于理解和优化。
风险分析
- 策略依赖于趋势性市场,在震荡市场中表现可能欠佳。
- 多个指标的参数设置可能需要根据不同市场和资产进行优化,否则可能导致策略表现不佳。
- 止损和止盈设置固定,可能无法适应市场的变化,导致损失加大或利润减少。
- 多时间框架交易可能增加交易频率,导致交易成本增加。
解决方法: 1. 引入适应性参数优化,根据市场变化自动调整指标参数。 2. 对止损和止盈进行动态调整,如使用跟踪止损或变动止盈。 3. 在回测中考虑交易成本,选择最优的时间框架和交易频率。
优化方向
- 引入其他趋势确认指标,如布林带、均线系统等,提高趋势判断的准确性。
- 优化止损和止盈设置,如采用动态止损止盈或基于波动率的止损止盈。
- 在交易信号中加入更多的过滤条件,如交易量、市场情绪等,提高信号质量。
- 对不同市场和资产进行参数优化,找出最优参数组合。
- 考虑引入机器学习算法,自适应市场变化,提高策略的适应性和稳定性。
通过以上优化,可以提高策略的鲁棒性和盈利能力,更好地适应不同市场环境。
总结
该策略通过结合MACD、ADX和EMA200等指标,在多个时间框架下进行趋势交易,具有一定的优势和可行性。策略的关键在于趋势判断和趋势强度确认,通过多个指标的共同作用,可以较好地捕捉趋势性机会。同时,策略采用固定止损止盈,有助于控制风险。但策略也存在一些局限性,如对震荡市场的适应性可能较差,且固定止损止盈可能无法适应市场变化。未来可以考虑引入更多的趋势确认指标、优化止损止盈方式、加入过滤条件、进行参数优化,以及引入机器学习算法等,不断提升策略的表现。总的来说,该策略思路清晰,实现简单,可以作为一个基础策略进行进一步的优化和改进,在实际应用中有一定的参考价值。
策略源码
/*backtest
start: 2024-02-01 00:00:00
end: 2024-02-29 23:59:59
period: 1h
basePeriod: 15m
exchanges: [{"eid":"Futures_Binance","currency":"BTC_USDT"}]
*/

// This Pine Script™ code is subject to the terms of the Mozilla Public License 2.0 at https://mozilla.org/MPL/2.0/
// © colemanrumsey

//@version=5
strategy("15-Minute Trend Trading Strategy", overlay=true)

// Exponential Moving Average (EMA)
ema200 = ta.ema(close, 200)

// MACD Indicator
[macdLine, signalLine, _] = ta.macd(close, 12, 26, 9)
macdHistogram = macdLine - signalLine

// Calculate True Range (TR)
tr = ta.tr

// Calculate +DI and -DI
plusDM = high - high[1]
minusDM = low[1] - low

atr14 = ta.atr(14)
plusDI = ta.wma(100 * ta.sma(plusDM, 14) / atr14, 14)
minusDI = ta.wma(100 * ta.sma(minusDM, 14) / atr14, 14)

// Calculate Directional Movement Index (DX)
dx = ta.wma(100 * math.abs(plusDI - minusDI) / (plusDI + minusDI), 14)

// Calculate ADX
adxValue = ta.wma(dx, 14)

// Long Entry Condition
longCondition = close > ema200 and (macdLine > signalLine) and (macdLine < 0) and (adxValue >= 25)

// Short Entry Condition
shortCondition = close < ema200 and (macdLine < signalLine) and (macdLine > 0) and (adxValue >= 25)

// Calculate ATR for Stop Loss
atrValue = ta.atr(14)

// Initialize Take Profit and Stop Loss
var float takeProfit = na
var float stopLoss = na

// Calculate Risk (Stop Loss Distance)
risk = close - low[1]  // Using the previous candle's low as stop loss reference

// Strategy Orders
if longCondition
    stopLoss := close * 0.99  // Set Stop Loss 1% below the entry price
    takeProfit := close * 1.015 // Set Take Profit 1.5% above the entry price
    strategy.entry("Buy", strategy.long, stop=stopLoss, limit=takeProfit)

if shortCondition
    stopLoss := close * 1.01 // Set Stop Loss 1% above the entry price
    takeProfit := close * 0.985 // Set Take Profit 1.5% below the entry price
    strategy.entry("Sell", strategy.short, stop=stopLoss, limit=takeProfit)

// Plot EMA
// plot(ema200, color=color.blue, linewidth=1, title="200 EMA")

// Plot MACD Histogram
// plot(macdHistogram, color=macdHistogram > 0 ? color.green : color.red, style=plot.style_columns, title="MACD Histogram")

// Display ADX Value
// plot(adxValue, color=color.purple, title="ADX Value")