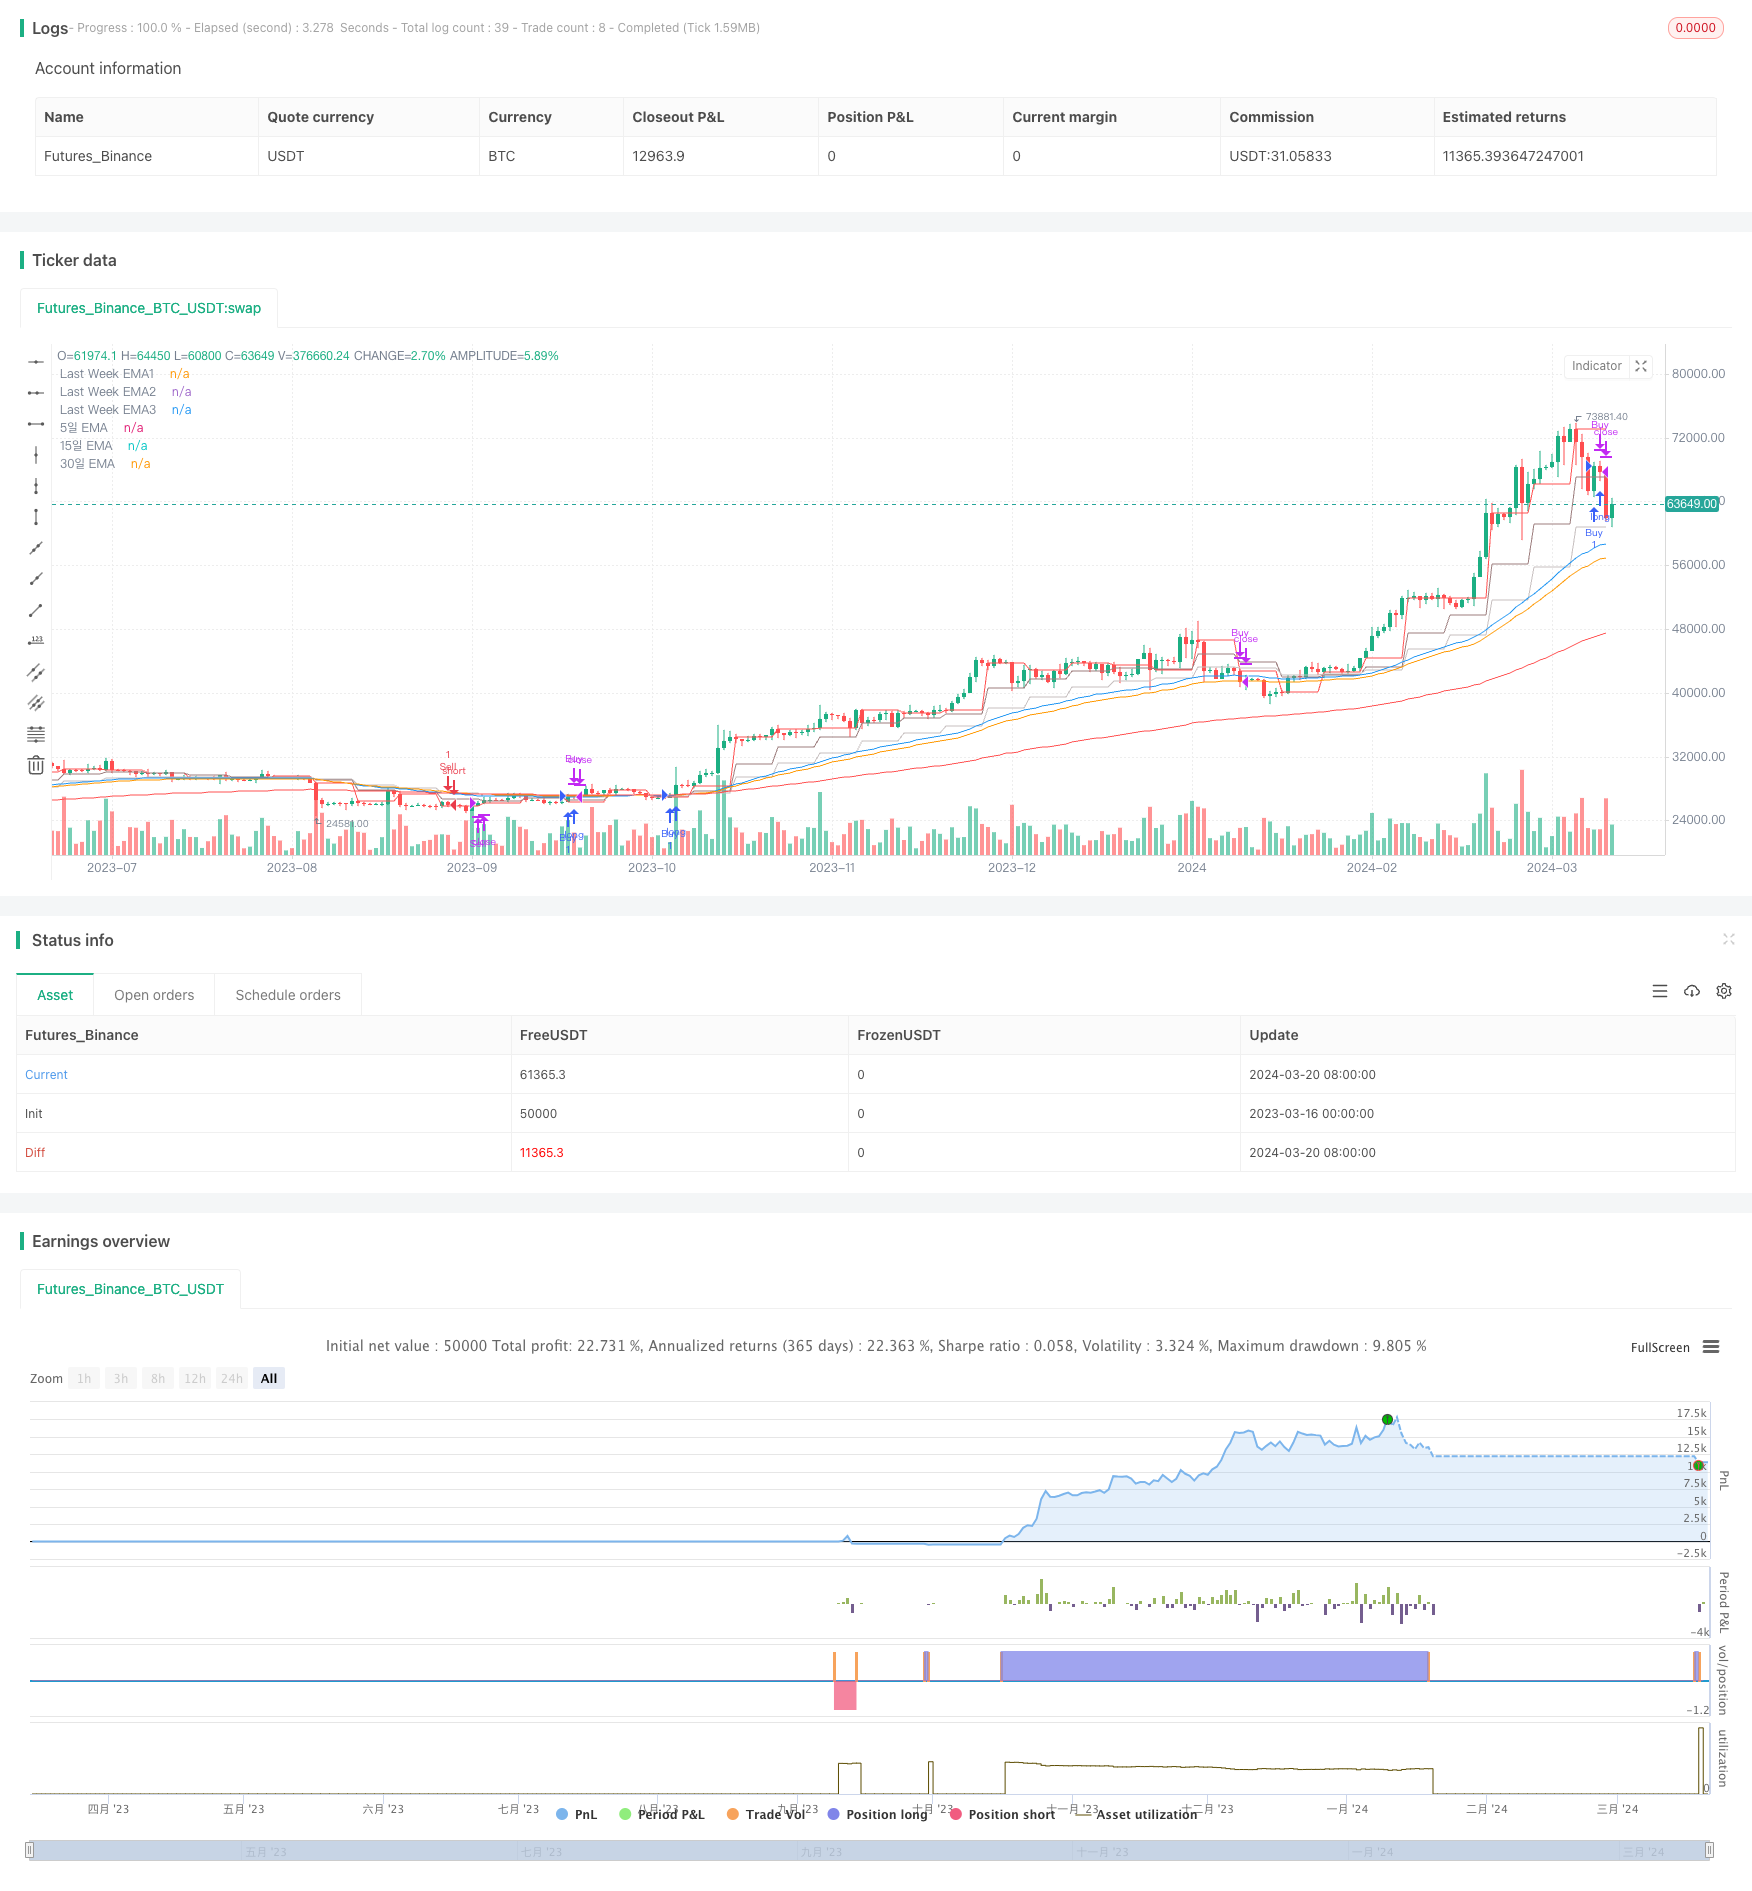
概述
该策略结合了MACD指标和多个EMA线,从周线和分钟线两个时间尺度来捕捉市场的强势趋势。在周线上使用MACD指标来判断大趋势方向,在分钟线上使用5日、15日、30日三条EMA线来确认趋势,并在突破点进行交易。该策略主要思想是跟随强势趋势,骑在大浪之上,短期EMA线突破长期EMA线时进场交易,EMA线回撤或止损条件触发时离场。
策略原理
周线MACD判断大趋势:计算周线MACD指标,对比本周和上周的MACD柱状图差值,差值大于0表明趋势向上,小于0表明趋势向下。每周一开盘时更新趋势方向。
多EMA线确认趋势:在分钟线图上绘制5日、15日、30日三条EMA线。当短期EMA在长期EMA之上且向上运行时,趋势向上;反之趋势向下。
EMA线交叉点交易:
- 做多:当周线MACD趋势向上,且分钟线收盘价上穿15日EMA时做多。止损位设在持仓均价下固定点数,或当5日EMA下穿15日EMA时平仓。
- 做空:当周线MACD趋势向下,且5日EMA下穿30日EMA时做空。止损位设在持仓均价上固定点数,或当5日EMA上穿15日EMA时平仓。
加仓:暂不设置加仓条件。
优势分析
双时间尺度结合,趋势判断更加可靠。周线MACD判断大趋势,避免在震荡市做多被套;分钟线EMA交叉确认趋势,抓住趋势中的每一波行情。
分钟线EMA参数选择5、15、30日,三线组合能够很好地过滤掉噪音,捕捉到明确的趋势。
止损位设置合理,控制单次交易风险。固定点数止损和EMA止损相结合,既能控制损失,又能跟随趋势。
代码模块化设计,主要模块如MACD计算、EMA计算等,具有很强的复用性和可扩展性。
风险分析
MACD柱状图差值阈值选择不当,可能导致趋势判断标准过于宽松或严格,使判断失准。可以通过回测和参数优化来选择最佳阈值。
分钟线EMA参数选择不当,周期过短会导致频繁交易,过长会错失良机。可以通过回测和参数优化来选择最佳参数组合。
固定点数止损位置选择不当,设置过小会导致频繁止损,设置过大会导致单次亏损过多。可以根据品种波动特性来设置个性化止损。
趋势转折点EMA线会有所滞后,可能错过最佳买卖点。但从长期来看,能够有效控制风险,策略整体表现依然不错。
优化方向
可以考虑在MACD判断趋势的基础上,再叠加RSI等指标来确认趋势强度,提高趋势判断的准确性。
可以在EMA线交叉的基础上,增加CCI等指标作为交易信号的过滤条件,降低交易频率和риск。
可以根据个股的历史波动特性,设置个性化的止损点数,使策略更加贴合品种特点。
可以考虑增加加仓和减仓的策略,在趋势较强时逐步加仓,在趋势减弱时逐步减仓,提高资金利用效率。
总结
MACD+EMA多时间尺度突破策略是一个趋势跟踪型策略,在判断趋势和确认趋势上都有比较科学的依据,能够有效把握住市场的主要趋势,获得稳定的收益。同时,该策略在风险控制方面也比较完善,通过合理的止损设置和平仓条件,有效地控制了策略回撤。但策略也存在一些不足,如趋势判断滞后、缺乏加减仓等,可以在此基础上进一步优化和完善。总的来说,该策略是一个非常值得学习和使用的量化交易策略。
/*backtest
start: 2023-03-16 00:00:00
end: 2024-03-21 00:00:00
period: 1d
basePeriod: 1h
exchanges: [{"eid":"Futures_Binance","currency":"BTC_USDT"}]
*/


// 1) 전주와 전전주의 히스토그램의 차이를 계산하여, 매주 월요일에 매매 방향을 표시하고,
// 2) 5일, 15일, 30일 선을 호출하여 평행하게 그리고, 매매 방향에 따라
// 3) 분봉기준의 이동평균선 매매전략
// 4) 수익 실현은 미설정 해둠


//@version=5
strategy('Last week MACD+ 15day, 30day break through, by Ho.J', overlay=true, initial_capital=30000, commission_value = 7.5, commission_type=strategy.commission.cash_per_order, slippage = 0)

// 백테스팅 기간 설정
start_time = input(timestamp("Jan 19 2024 00:00:01"), confirm = true)
end_time = input(timestamp("MAR 19 2024 23:59:59"), confirm = true)
is_in_time = true
stopLoss = input.int(100, title="손절 수준")


// 지난주 값 불러오기 입력 매개변수, 1은 5일, 3은 15일, 6은 30일 이동평균선을 구하는 변수임
emaLength1 = input(1, title="EMA Length")
emaLength2 = input(3, title="EMA Length")
emaLength3 = input(6, title="EMA Length")
timeframePeriod = "W" // 'D'는 일간 데이터를 의미


// 분봉기준 EMA 계산
shortEMA = ta.ema(close, 50)
mediumEMA = ta.ema(close, 60)
longEMA = ta.ema(close, 150)


// 분봉기준 EMA 그리기
plot(shortEMA, color=color.blue, title="5일 EMA")
plot(mediumEMA, color=color.orange, title="15일 EMA")
plot(longEMA, color=color.red, title="30일 EMA")


// 주간 MACD 계산, 전주와 전전주 히스토그램을 계산하여 상대적인 상승, 하락을 계산
[macdLine, signalLine, _] = ta.macd(close, 12, 26, 9)
histogram = macdLine - signalLine
histLastWeek = request.security(syminfo.tickerid, timeframePeriod, histogram[1], lookahead=barmerge.lookahead_on)
histWeekBeforeLast = request.security(syminfo.tickerid, timeframePeriod, histogram[2], lookahead=barmerge.lookahead_on)
histDiff = histLastWeek - histWeekBeforeLast


// 현재 주의 월요일 첫 봉인지 확인
isMondayFirstBar = (dayofweek == dayofweek.monday) and (hour == 09) and (minute == 00) // 여기서 시간은 시장 개장 시간에 따라 조정해야 함


// 월요일 첫봉에, 주간 MACD 히스토그램이 상승하면 '매수', 하락하면 '매도' 표시
var label myLabel = na
if (isMondayFirstBar)
    if (histDiff > 0)
        myLabel := label.new(bar_index, high, "이번주는 매수만", color=color.green, textcolor=color.white, style=label.style_label_down, size=size.large)
    else if (histDiff < 0)
        myLabel := label.new(bar_index, low, "이번주는 매도만", color=color.red, textcolor=color.white, style=label.style_label_up, size=size.large)


// 지난주 EMA 값 요청
// 'lookahead'를 사용하여 지난 데이터를 기준으로 계산
lastWeekEMA1 = request.security(syminfo.tickerid, timeframePeriod, ta.ema(close[1], emaLength1), lookahead=barmerge.lookahead_on)
lastWeekEMA2 = request.security(syminfo.tickerid, timeframePeriod, ta.ema(close[1], emaLength2), lookahead=barmerge.lookahead_on)
lastWeekEMA3 = request.security(syminfo.tickerid, timeframePeriod, ta.ema(close[1], emaLength3), lookahead=barmerge.lookahead_on)

// 지난주 EMA 그리기
plot(lastWeekEMA1, color=color.red, title="Last Week EMA1")
plot(lastWeekEMA2, color=color.rgb(157, 126, 126), title="Last Week EMA2")
plot(lastWeekEMA3, color=color.rgb(199, 192, 192), title="Last Week EMA3")


// 매수/매도 조건
buySignal = ta.crossover(close, lastWeekEMA2) and histDiff > 0
// addbuySignal = ta.crossover(close, lastWeekEMA3) and histDiff > 0

sellSignal = ta.crossunder(shortEMA, longEMA) and histDiff < 0
// addSellSignal = ta.crossunder(close, lastWeekEMA3) and histDiff < 0


// 매수 조건
if (buySignal)
    strategy.entry('Buy', strategy.long)
    alert('Buy Signal', alert.freq_once_per_bar_close)

// if (addbuySignal)
   // strategy.entry('Buy', strategy.long)
   // alert('add Buy Signal', alert.freq_once_per_bar_close)

if (strategy.position_size > 0 and ((strategy.position_avg_price - close) >= stopLoss) or ta.crossunder(close, mediumEMA))
    strategy.close('Buy')
    alert('Close Buy Signal', alert.freq_once_per_bar_close)

// 매도 조건
if (sellSignal)
    strategy.entry('Sell', strategy.short)
    alert('Sell Signal', alert.freq_once_per_bar_close)

//if (addSellSignal)
   // strategy.entry('Sell', strategy.short)
   // alert('add Sell Signal', alert.freq_once_per_bar_close)

if (strategy.position_size < 0 and ((close - strategy.position_avg_price) >= stopLoss) or ta.crossover(shortEMA, mediumEMA))
    strategy.close('Sell')
    alert('Close Sell Signal', alert.freq_once_per_bar_close)