概述 Overview
该策略利用两条移动平均线的交叉来判断市场趋势的转变,并根据趋势进行买卖操作。当短期均线上穿长期均线时做多,短期均线下穿长期均线时做空,以跟随趋势方向进行交易。
策略原理 Strategy Principle
该策略的核心是两条移动平均线:一条快速均线(默认周期为32)和一条慢速均线(默认周期也为32,可通过参数调整)。当收盘价上穿/下穿这两条均线形成的通道时,代表趋势发生逆转,策略据此产生买卖信号:
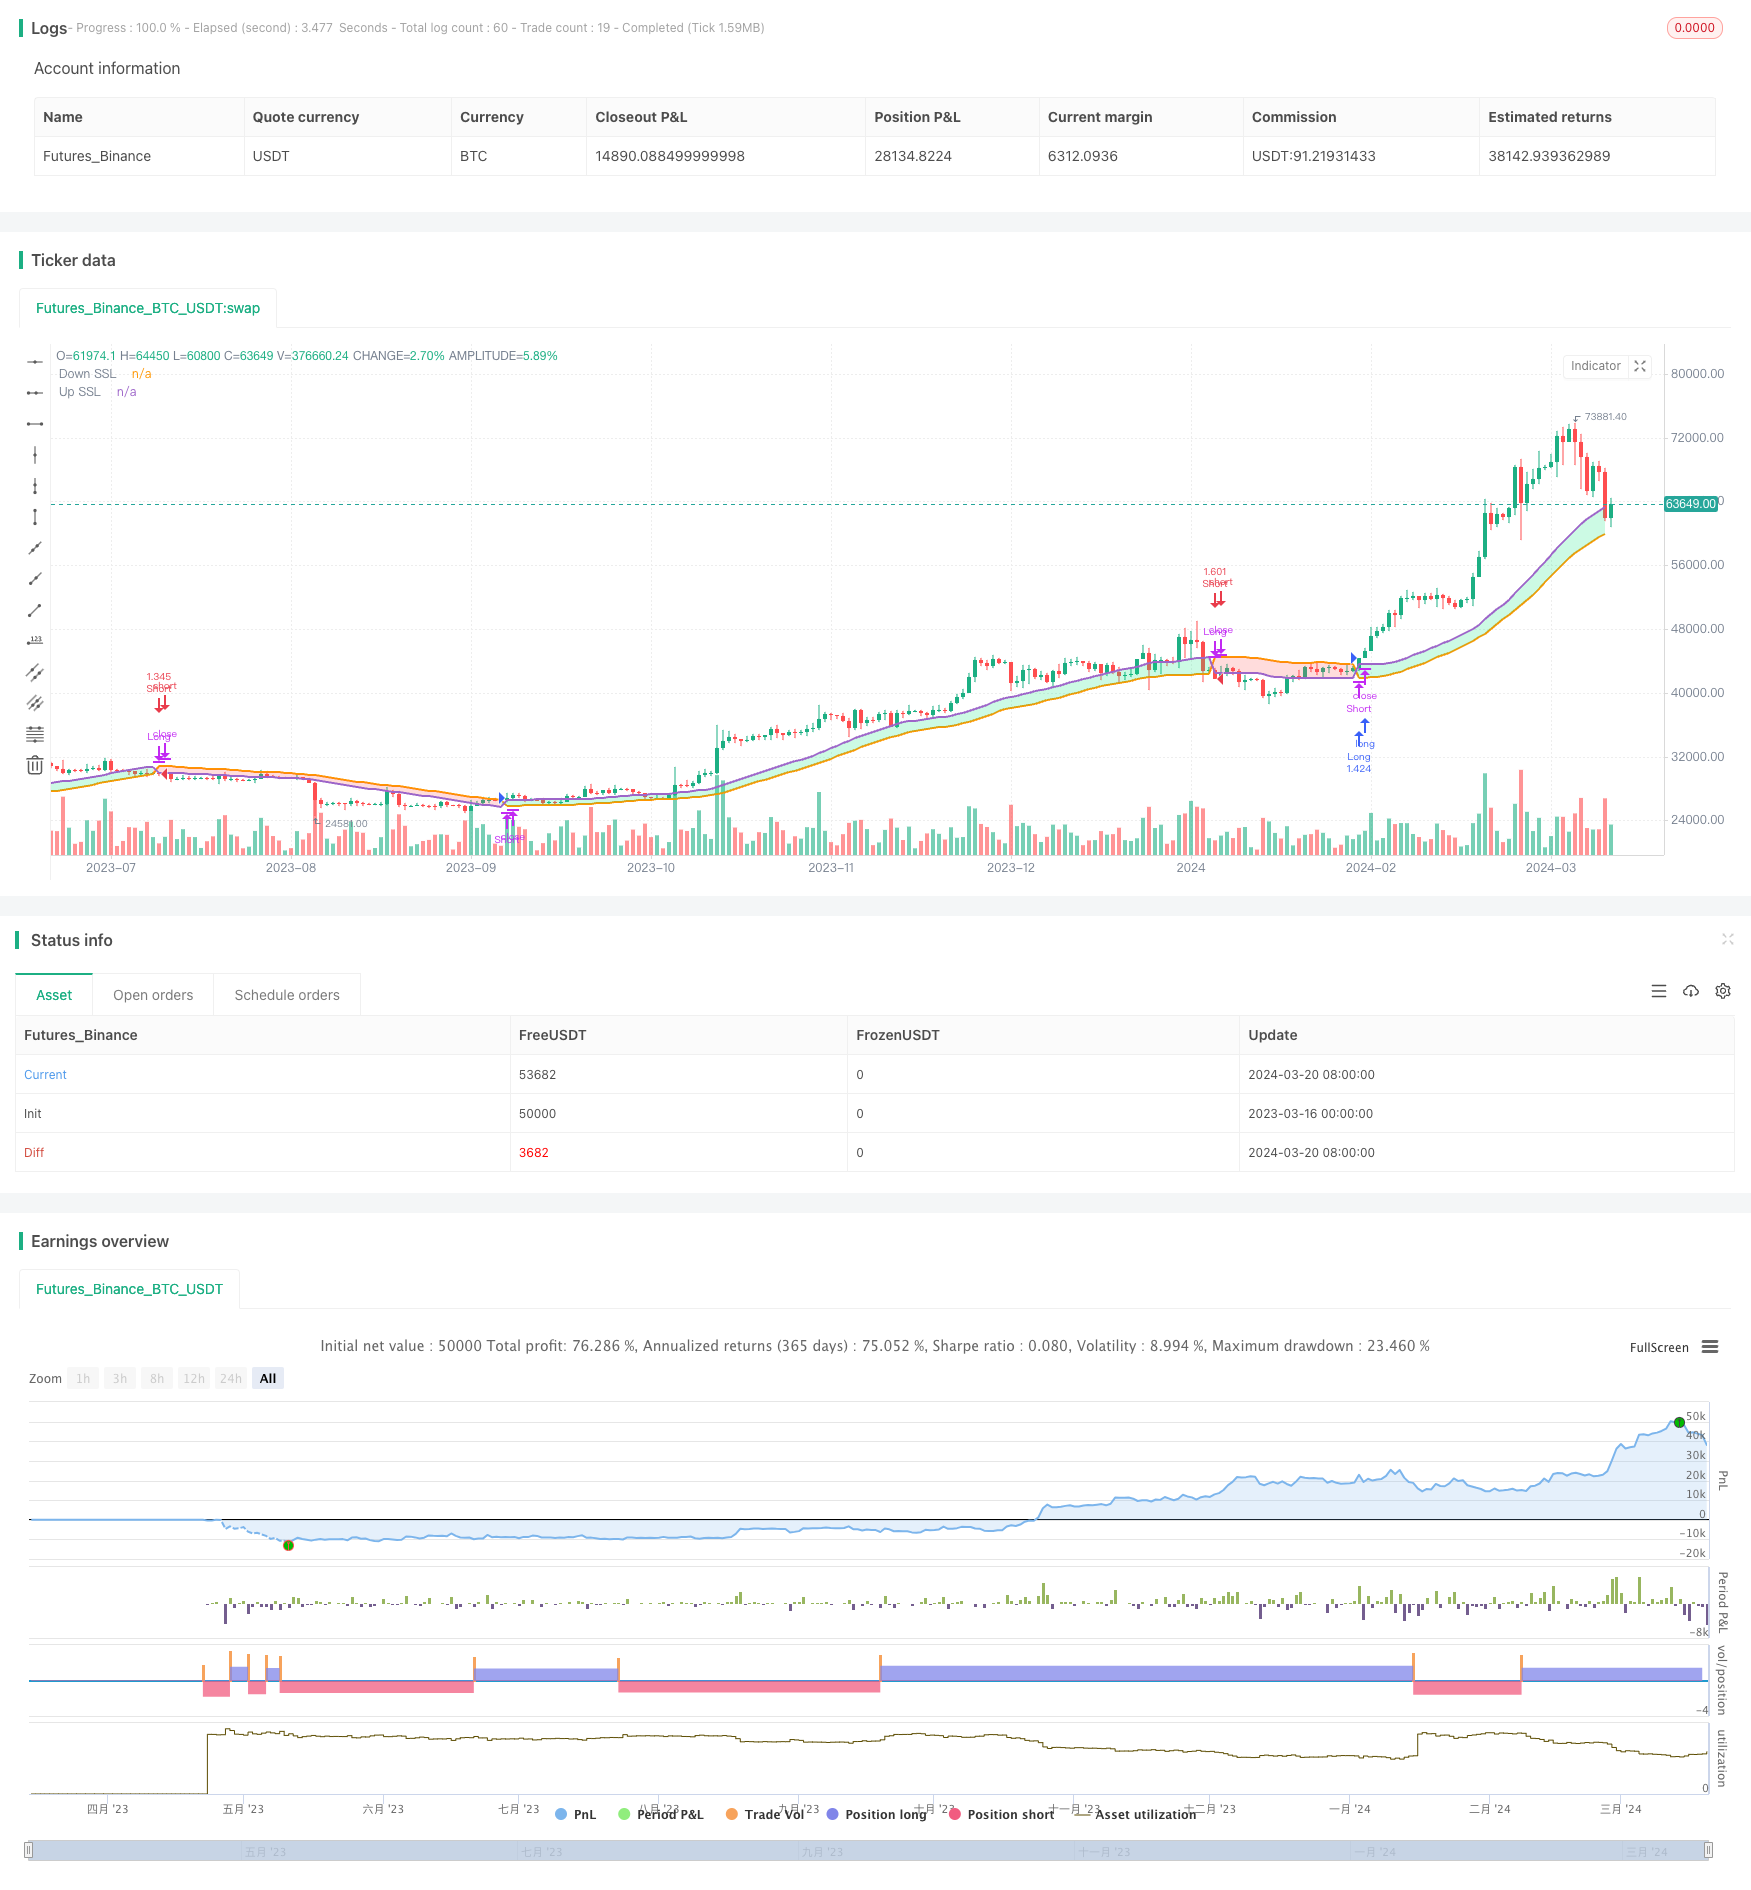
- 当快速均线上穿慢速均线时,做多
- 当快速均线下穿慢速均线时,做空
- 当已持有多单时,快速均线下穿慢速均线,平多并做空
- 当已持有空单时,快速均线上穿慢速均线,平空并做多
通过这种均线交叉的方式,策略可以跟随趋势,在上涨趋势中持有多单,在下跌趋势中持有空单,直到趋势出现反转信号。
优势分析 Advantage Analysis
- 趋势跟踪:该策略通过均线交叉判断趋势,能够有效捕捉并顺应市场的主要趋势。
- 简单易用:策略逻辑清晰,只使用了两条均线,参数设置简单,容易理解和掌握。
- 适用性广:策略对品种和周期的适用性较广,可以在多种市场中使用。
- 及时止损:当趋势出现反转,策略能够及时平仓,控制损失。
风险分析 Risk Analysis
- 震荡市中表现较差:当市场处于震荡走势时,频繁的交叉信号会导致策略频繁交易而损失较多。
- 突发行情应对不足:面对极端行情(如快速拉升或暴跌),策略可能反应不及,导致较大亏损。
- 参数优化难度大:均线参数的优化需要大量的历史数据和回测,且参数对未来效果的指导性有限。
针对以上风险,可以考虑增加适当过滤,比如ATR或平均真实波幅过滤,降低震荡市中的过度交易;设置合理的止损,控制单次亏损;持续优化参数以适应市场。但策略本身的局限性难以完全规避。
优化方向 Optimization Direction
- 趋势确认:在产生交易信号后,可以再加入一些趋势确认指标,如MACD、DMI等,以进一步过滤信号。
- 动态止损:根据ATR等指标设置动态止损位,而不是固定的百分比或价格止损,可以更好地控制风险。
- 仓位管理:根据趋势强度、波动率等指标,动态调整仓位大小,在趋势强时加大仓位,趋势弱时减仓。
- 多周期多级别:考虑多个级别的均线系统,如日线+4小时线,互相过滤和确认,提高趋势把握的准确性。
- 参数自适应:引入自适应参数优化方法,如遗传算法等,让策略参数能够适应不同的市场状态。
以上优化可以提高策略应对复杂市场的能力,但需要注意过度优化可能导致曲线拟合,造成未来表现不佳。
总结 Summary
双均线趋势跟踪策略通过均线交叉捕捉趋势,具有简单易用、适用性广的特点。但其在震荡市表现不佳,对极端行情应对不足,且参数优化难度较大。可以通过引入更多过滤指标、动态止损、仓位管理、多周期结合、参数自适应等方法对策略进行优化。但均线策略本身的局限性难以完全规避,实盘中仍需谨慎,根据市场特点灵活调整。总的来说,该策略可以作为趋势跟踪的基础策略,但难以单独立足,更适合作为组合策略的一部分。
策略源码
/*backtest
start: 2023-03-16 00:00:00
end: 2024-03-21 00:00:00
period: 1d
basePeriod: 1h
exchanges: [{"eid":"Futures_Binance","currency":"BTC_USDT"}]
*/

//@version=5

//study(title="Demo - SSL Basic", shorttitle="Demo - SSL Basic", overlay=true)
strategy(title='Demo - SSL Basic', shorttitle='Demo - SSL Basic', overlay=true, default_qty_type=strategy.percent_of_equity, default_qty_value=100, initial_capital=100, commission_value=0.15)

// Backtest Date Range
start_date_long = input(title='Backtest Long Start Date', defval=timestamp('01 Jan 2018 00:00 +0530'))
end_date_long = input(title='Backtest Long End Date', defval=timestamp('25 Jan 2030 00:00 +0530'))
backtest_range = true

// Inputs
maType = input.string(title='SSL MA Type', options=['SMA', 'EMA', 'WMA'], defval='SMA')
sslLen = input(title='SSL Length', defval=32)
showCross = input(title='Show Crossover?', defval=true)
showEntry = input(title='Show Entry?', defval=true)
showTrend = input(title='Show Trend Colors?', defval=true)

// Calc MA for SSL Channel
calc_ma(close, len, type) =>
    float result = 0
    if type == 'SMA'  // Simple
        result := ta.sma(close, len)
        result
    if type == 'EMA'  // Exponential
        result := ta.ema(close, len)
        result
    if type == 'WMA'  // Weighted
        result := ta.wma(close, len)
        result
    result

// Add SSL Channel
maHigh = calc_ma(high, sslLen, maType)
maLow = calc_ma(low, sslLen, maType)
Hlv = int(na)
Hlv := close > maHigh ? 1 : close < maLow ? -1 : Hlv[1]
sslDown = Hlv < 0 ? maHigh : maLow
sslUp = Hlv < 0 ? maLow : maHigh
ss1 = plot(sslDown, title='Down SSL', linewidth=2, color=showTrend ? na : color.red)
ss2 = plot(sslUp, title='Up SSL', linewidth=2, color=showTrend ? na : color.lime)

// Conditions
longCondition = ta.crossover(sslUp, sslDown)
shortCondition = ta.crossover(sslDown, sslUp)

// Strategy
if shortCondition
    strategy.close('Long', comment='Long Exit', alert_message='JSON')

if longCondition
    strategy.close('Short', comment='Short Exit', alert_message='JSON')

if backtest_range and longCondition
    strategy.entry('Long', strategy.long, comment='Long Entry', alert_message='JSON')

if backtest_range and shortCondition
    strategy.entry('Short', strategy.short, comment= 'Short Entry', alert_message='JSON')


// Plots
fill(ss1, ss2, color=showTrend ? sslDown < sslUp ? color.new(color.lime, transp=75) : color.new(color.red, transp=75) : na, title='Trend Colors')