策略概述
烛台形态趋势过滤策略是一种结合技术分析工具来提升交易决策的量化交易策略。该策略通过识别特定的烛台形态,同时使用趋势过滤器来判断整体市场方向。通过结合这两种技术分析方法,该策略旨在捕捉市场趋势中的有利交易机会,提高交易准确率和盈利能力。
策略原理
该策略的核心原理是利用烛台形态和趋势过滤指标来识别潜在的交易信号。首先,策略通过识别特定的看涨和看跌烛台形态,如看涨吞没形态、看跌吞没形态、乌云盖顶和启明星等,来判断市场情绪和潜在的价格走势。这些烛台形态能够提供有关买卖压力强度的重要信息。
其次,策略采用了两条指数移动平均线(EMA)作为趋势过滤器,分别为14周期EMA和60周期EMA。当收盘价高于这两条EMA时,市场被认为处于上升趋势;当收盘价低于这两条EMA时,市场被视为下降趋势。通过结合烛台形态和趋势过滤器,该策略能够在趋势方向上识别出高概率的交易机会。
当特定的看涨烛台形态出现,并且市场处于上升趋势时,策略会产生做多信号。相反,当出现看跌烛台形态,并且市场处于下降趋势时,策略会产生做空信号。这种结合方式能够有效地过滤掉虚假信号,提高交易信号的可靠性。
策略优势
- 结合了烛台形态和趋势过滤器两种技术分析方法,能够更全面地分析市场状况,提高交易决策的准确性。
- 通过识别特定的烛台形态,策略能够捕捉市场情绪的变化和潜在的价格走势,为交易提供有价值的信息。
- 趋势过滤器的使用能够有效地过滤掉虚假信号,确保交易信号与主要趋势保持一致,提高交易成功率。
- 策略逻辑清晰,易于理解和实现,适合不同经验水平的交易者使用。
策略风险
- 烛台形态的可靠性可能受到市场波动和噪音的影响,导致产生虚假信号。
- 趋势过滤器可能出现滞后,特别是在市场趋势转折点附近,可能错过一些交易机会。
- 策略依赖于历史数据进行分析和决策,对于突发事件和基本面变化的应对能力有限。
- 策略缺乏对风险管理的考虑,如止损和仓位管理,可能导致潜在的大额损失。
针对这些风险,可以考虑以下解决方法:
- 结合其他技术指标或基本面分析,以验证烛台形态产生的交易信号,提高信号可靠性。
- 优化趋势过滤器的参数设置,如使用自适应的动态参数,以更好地适应市场变化。
- 引入风险管理措施,如设置适当的止损位和仓位控制,以限制潜在损失。
- 定期回测和评估策略性能,根据市场变化和策略表现进行必要的调整和优化。
优化方向
- 引入多时间框架分析:在当前策略的基础上,引入多个时间框架的分析,如日线、4小时线和1小时线等。通过分析不同时间框架的烛台形态和趋势,可以获得更全面和可靠的交易信号,提高策略的稳健性。
- 优化趋势过滤器:对趋势过滤器的参数进行优化,如尝试不同的EMA周期组合,或者引入其他趋势指标,如MACD、ADX等,以更好地捕捉趋势变化。通过优化趋势过滤器,可以减少虚假信号,提高交易信号的质量。
- 加入风险管理模块:在策略中加入风险管理模块,包括止损、仓位管理和资金管理等。通过设置适当的止损位,可以有效控制单笔交易的最大损失;通过动态调整仓位大小,可以根据市场波动和账户资金情况,适当控制风险敞口;通过资金管理,可以优化资金配置,提高资金利用效率。
- 结合市场情绪指标:引入市场情绪指标,如恐慌指数(VIX)、看跌期权/看涨期权比率(PCR)等,以衡量市场情绪和风险偏好。通过分析市场情绪,可以调整策略的风险敞口,在市场情绪极端时采取更谨慎的交易方式,提高策略的适应性。
- 增加过滤条件:在当前策略的基础上,增加更多的过滤条件,以提高交易信号的质量。例如,可以引入交易量指标,选择交易量放大的烛台形态作为交易信号;或者引入波动率指标,在波动率较低时进行交易,以避免在高波动市场中的风险。
通过以上优化方向,可以提升烛台形态趋势过滤策略的性能,获得更稳健和可靠的交易结果。不断优化和改进策略,是量化交易中重要的一环,有助于策略适应不断变化的市场环境。
总结
烛台形态趋势过滤策略通过结合烛台形态和趋势过滤器两种技术分析方法,能够识别出高概率的交易机会。该策略利用烛台形态来捕捉市场情绪和潜在价格走势,同时使用趋势过滤器来确保交易信号与主要趋势保持一致,从而提高交易决策的准确性。
该策略的优势在于逻辑清晰,易于理解和实现,同时结合了两种有效的技术分析工具。通过识别特定的烛台形态和趋势条件,策略能够产生可靠的交易信号,帮助交易者做出更明智的决策。
然而,该策略也存在一些风险和局限性。烛台形态的可靠性可能受到市场噪音的影响,趋势过滤器可能出现滞后,策略对突发事件和基本面变化的适应能力有限,且缺乏对风险管理的考虑。
为了优化该策略,可以考虑引入多时间框架分析、优化趋势过滤器参数、加入风险管理模块、结合市场情绪指标以及增加过滤条件等方法。通过不断优化和改进,可以提升策略的性能和稳健性,更好地适应不断变化的市场环境。
总的来说,烛台形态趋势过滤策略为交易者提供了一种结构化的交易方法,通过技术分析工具的有效结合,能够识别出有利的交易机会。虽然策略存在一些局限性和风险,但通过适当的优化和改进,可以提高策略的可靠性和盈利能力。在实践中,交易者应根据自己的风险偏好和交易风格,灵活运用该策略,并结合其他分析方法和风控措施,以获得更好的交易结果。
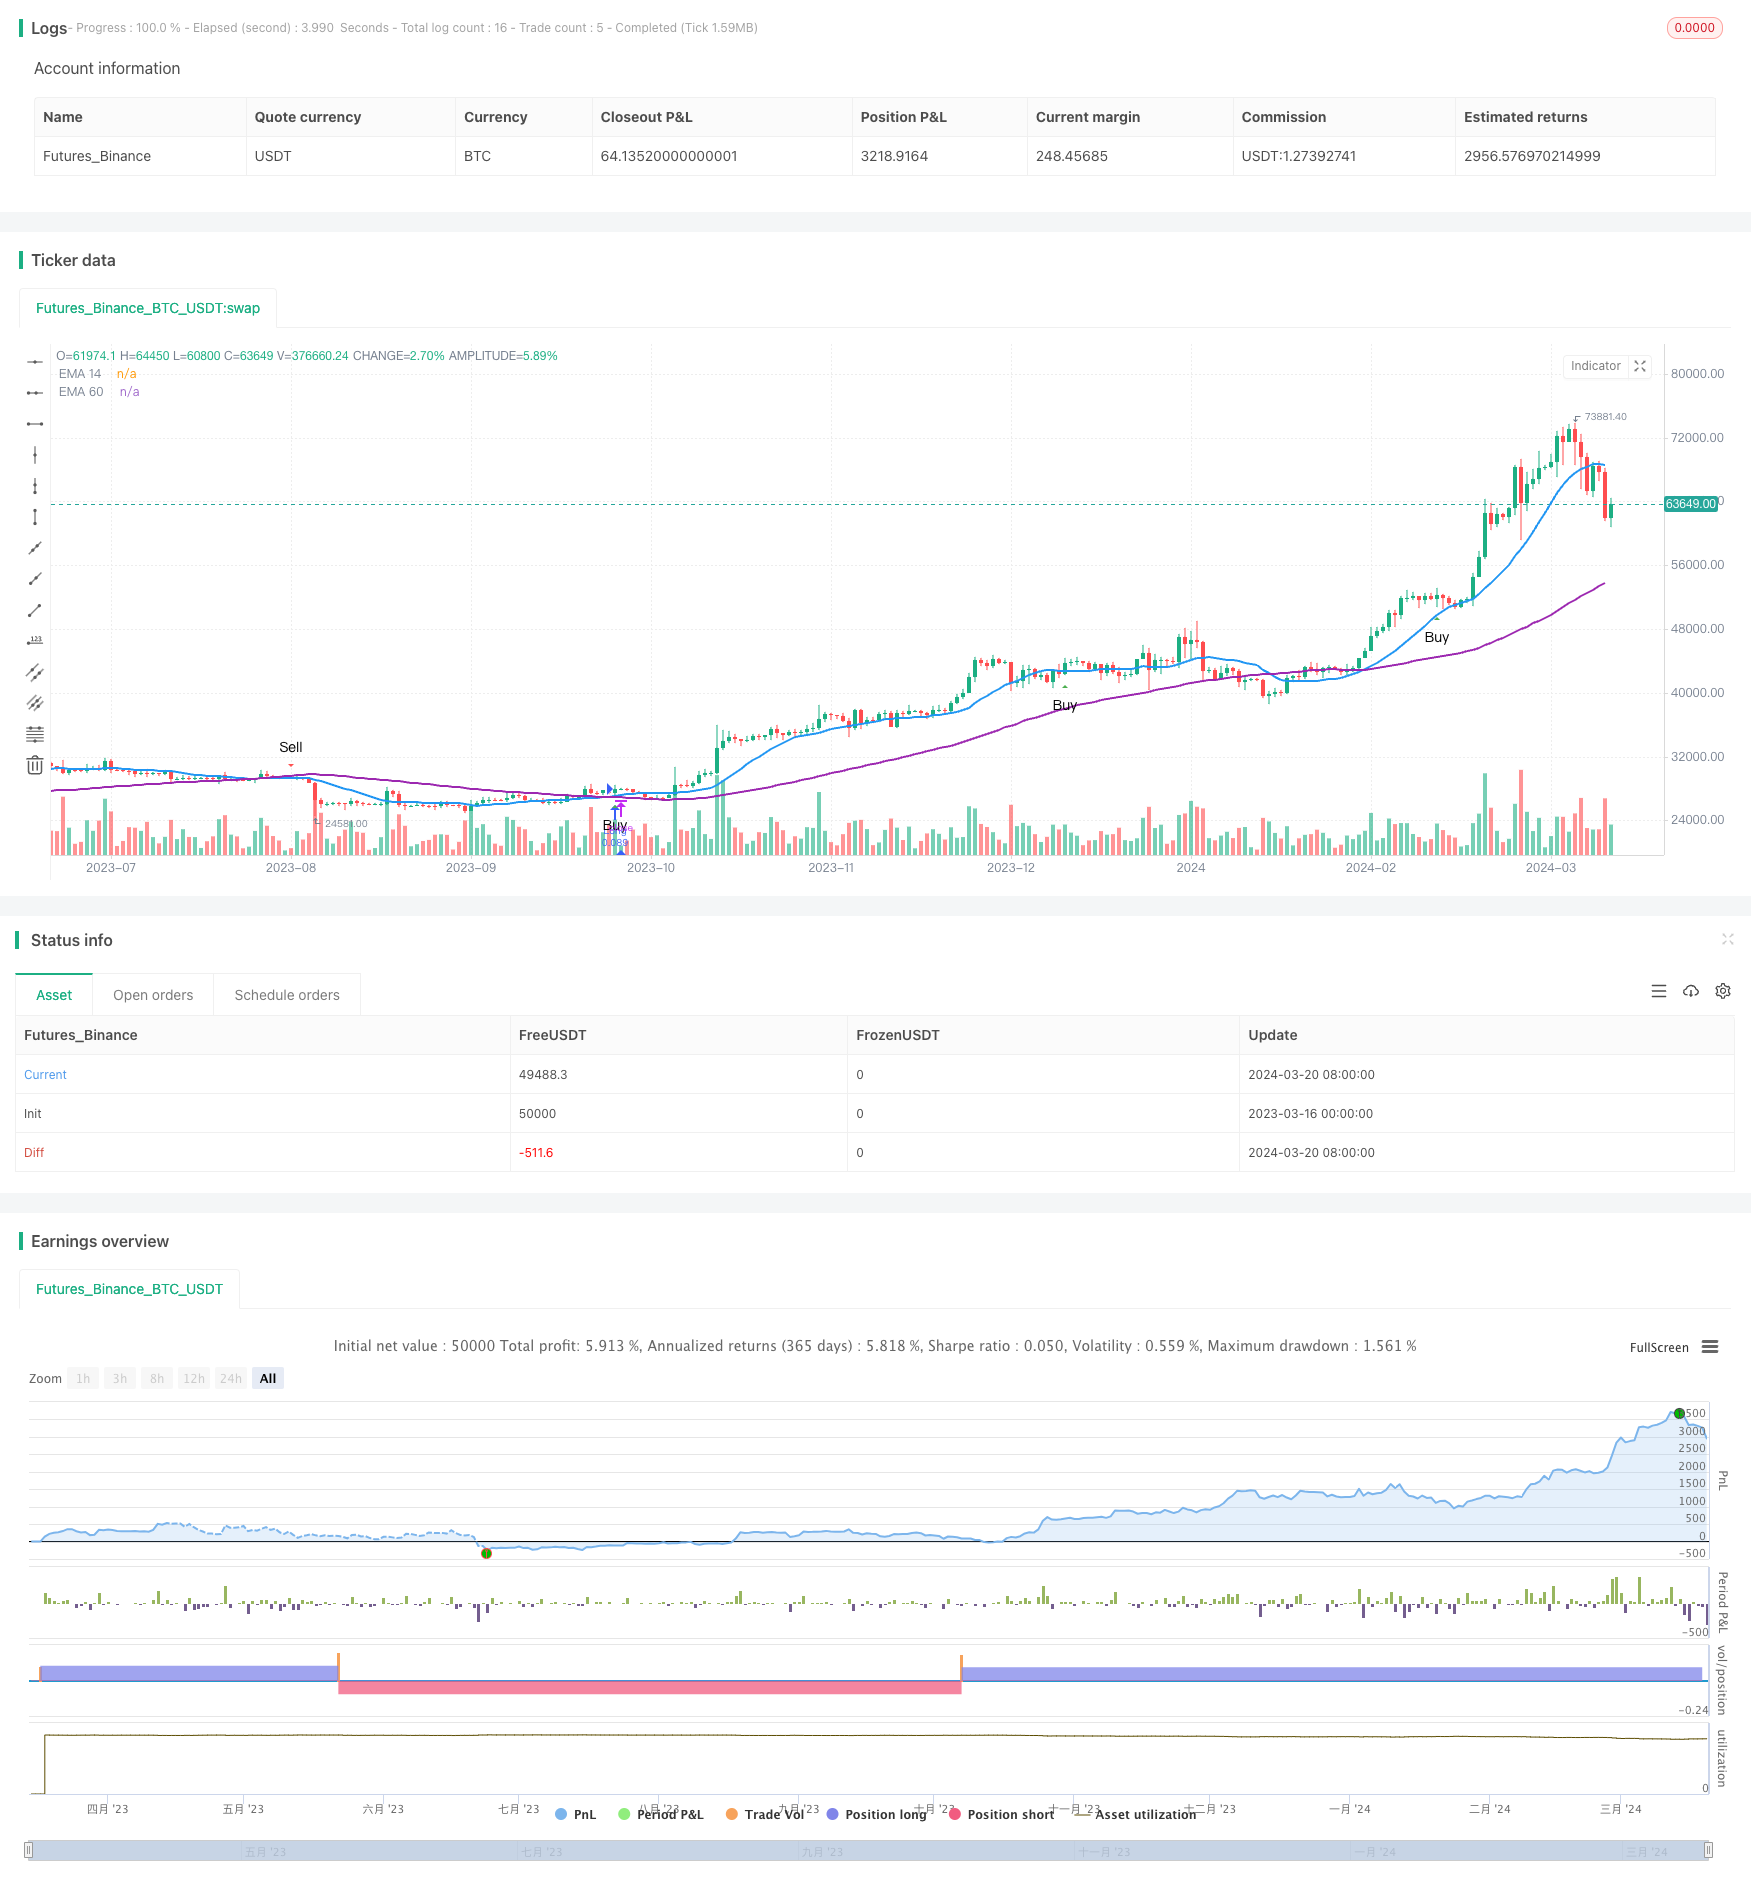
/*backtest
start: 2023-03-16 00:00:00
end: 2024-03-21 00:00:00
period: 1d
basePeriod: 1h
exchanges: [{"eid":"Futures_Binance","currency":"BTC_USDT"}]
*/

//@version=5
strategy("Candlestick Pattern Strategy with Trend Filters", overlay=true, default_qty_type=strategy.percent_of_equity, default_qty_value=5, initial_capital=10000, commission_type=strategy.commission.percent, commission_value=0.02)

// Custom SMA function
sma(src, length) =>
    sum = 0.0
    for i = 0 to length - 1
        sum += src[i]
    sum / length

// Calculations
bullishEngulfing = close > open and open < close[1] and close[1] < open[1] and close > open[1]
bearishEngulfing = close < open and open > close[1] and close[1] > open[1] and close < open[1]
darkCloudCover = close < open and open > close[1] and close < open[1]
morningStar = close[2] < open[2] and close[1] < open[1] and close[1] < close[2] and open[1] > close[2] and close > open and close > open[1]

ema14 = sma(close, 14)
ema60 = sma(close, 60)
upTrend = close > ema14 and close > ema60
downTrend = close < ema14 and close < ema60

// Entry Conditions
longCondition = (bullishEngulfing and close > ema14 and close > ema60 and upTrend) or (morningStar and close < ema60 and upTrend)
shortCondition = (bearishEngulfing and close < ema14 and close < ema60 and downTrend) or (darkCloudCover and close > ema14 and close > ema60 and downTrend)

// Plot Signals
plotshape(longCondition, title="Buy", style=shape.triangleup, location=location.belowbar, size=size.small, color=color.green, text="Buy")
plotshape(shortCondition, title="Sell", style=shape.triangledown, location=location.abovebar, size=size.small, color=color.red, text="Sell")
plot(ema14, title="EMA 14", color=color.blue, linewidth=2)
plot(ema60, title="EMA 60", color=color.purple, linewidth=2)

// Entry and Exit Orders
if (longCondition)
    strategy.entry("Long", strategy.long, comment="Long Entry")
if (shortCondition)
    strategy.entry("Short", strategy.short, comment="Short Entry")