Trend Following Strategy Based on Dual Moving Average Crossover and Multi-Timeframe DMI Indicator

Strategy Overview
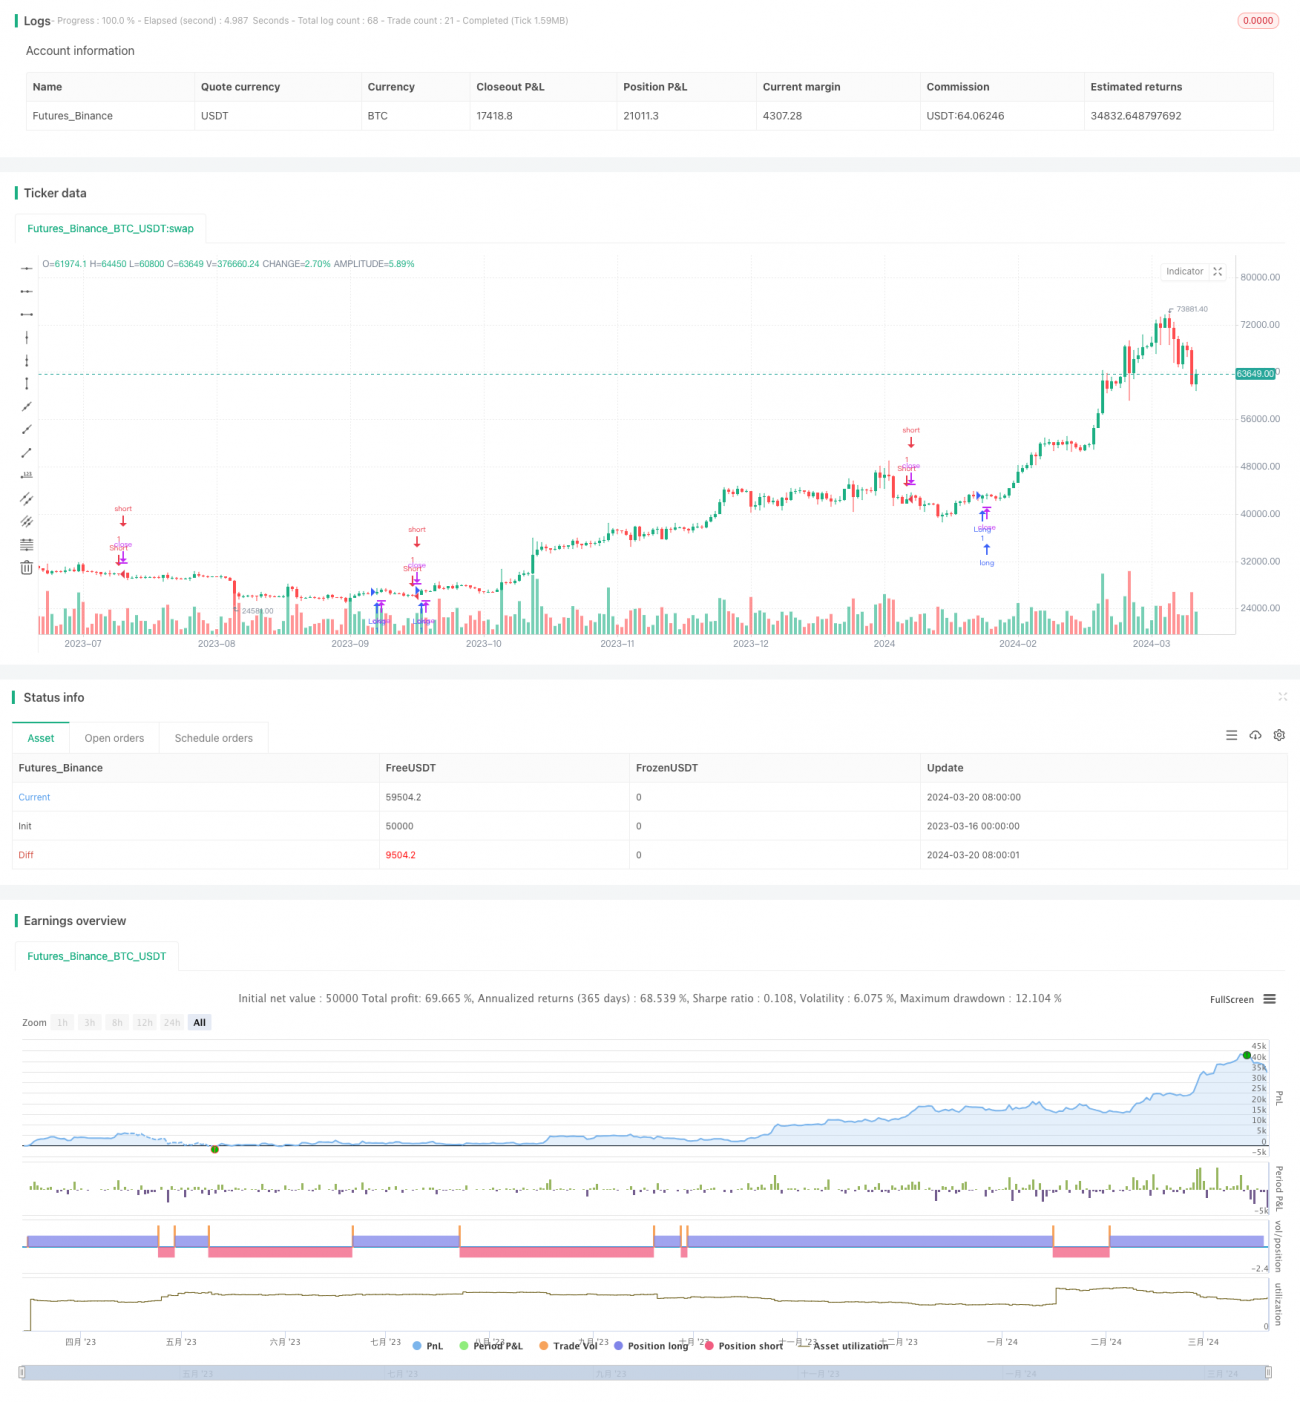
This article introduces a quantitative trading strategy named "Kyrie Crossover @zaytrade". The strategy combines dual moving average crossover and multi-timeframe DMI indicator to capture market trends for trading decisions. The core of the strategy is to utilize the crossover signals of a short-term moving average (10-period EMA) and a long-term moving average (323-period EMA), while confirming the trend direction and strength using DMI indicators across multiple timeframes such as 5-minute, 15-minute, 30-minute, and 1-hour.
Strategy Principles
The principles of this strategy can be divided into the following parts:
-
Dual Moving Average Crossover: The strategy uses a short-term EMA (10-period) and a long-term EMA (323-period) to capture market trends. When the short-term EMA crosses above the long-term EMA, it indicates a potential long opportunity; when the short-term EMA crosses below the long-term EMA, it indicates a potential short opportunity. This moving average crossover method can effectively identify market turning points and trend directions.
-
Multi-Timeframe DMI Indicator: To further confirm the trend direction and strength, the strategy employs DMI indicators across multiple timeframes. The DMI indicator consists of ADX (Average Directional Index), +DI (Positive Directional Indicator), and -DI (Negative Directional Indicator). By comparing the relative strength of +DI and -DI, it can be determined whether the current trend is bullish or bearish. The strategy calculates DMI indicators on 5-minute, 15-minute, 30-minute, and 1-hour timeframes to obtain more comprehensive trend information.
-
Trend Confirmation: The strategy confirms the trend by comprehensively considering the moving average crossover signals and multi-timeframe DMI indicators. When the moving average crossover signal aligns with the trend direction indicated by the DMI indicators, the strategy generates corresponding trading signals. For example, when the short-term EMA crosses above the long-term EMA, and multiple timeframes of DMI indicators show a bullish trend, the strategy generates a long signal.
-
Risk Management: The strategy employs a risk percentage-based position sizing method. Users can control the risk exposure of each trade by setting the
riskPercentageEMAparameter. Additionally, the strategy utilizes stop-loss orders to limit potential losses.
Strategy Advantages
-
Trend Capturing: By combining dual moving average crossover and multi-timeframe DMI indicators, the strategy can effectively capture the main trends in the market. This approach helps traders align with the market's overall direction, increasing the probability of successful trades.
-
Multi-Timeframe Confirmation: The strategy calculates DMI indicators on multiple timeframes, including 5-minute, 15-minute, 30-minute, and 1-hour. This multi-timeframe analysis approach provides more comprehensive and reliable trend confirmation signals, reducing the occurrence of false signals.
-
Flexible Parameter Settings: The strategy offers various adjustable parameters, such as short-term EMA period, long-term EMA period, ADX smoothing period, and DI length. Users can optimize these parameters based on their trading style and market characteristics to achieve better trading performance.
-
Risk Management: The strategy incorporates a risk percentage-based position sizing method, allowing users to control the risk exposure of each trade by setting the
riskPercentageEMAparameter. Moreover, the strategy utilizes stop-loss orders to limit potential losses, enhancing risk management effectiveness.
Strategy Risks
-
Parameter Optimization: The performance of the strategy largely depends on the choice of parameters. Improper parameter settings may lead to suboptimal strategy performance or even significant drawdowns. Therefore, in practical application, it is necessary to optimize and test the parameters to find the best parameter combination suitable for the current market conditions.
-
Trend Delay: As the strategy relies on moving average crossovers and DMI indicators to confirm trends, there may be a certain delay in signal generation during rapidly changing market conditions. This means that the strategy may miss some early trend opportunities or generate signals after the trend has already reversed.
-
Choppy Markets: In choppy markets, price fluctuations may lead to frequent moving average crossovers and changes in DMI indicators. This can result in the strategy generating more trading signals, increasing trading costs and drawdown risks. Therefore, the strategy's performance may be affected in choppy market conditions.
-
Black Swan Events: The strategy is based on historical data and statistical models. For extreme market events, such as black swan events, the strategy may not be able to react correctly in a timely manner. This can lead to significant losses for the strategy in these special circumstances.
Optimization Directions
-
Dynamic Parameter Adjustment: Consider introducing a dynamic parameter adjustment mechanism that adaptively adjusts strategy parameters based on market volatility and trend strength. This can help the strategy better adapt to different market environments and improve its robustness.
-
Multi-Factor Confirmation: In addition to moving average crossovers and DMI indicators, other technical indicators or fundamental factors can be introduced to further confirm trends. For example, combining volume, volatility, market sentiment, and other indicators can provide more reliable trading signals.
-
Stop-Loss and Take-Profit Optimization: Optimize the placement of stop-loss and take-profit levels, such as using trailing stops or dynamic stop-loss methods. This can help the strategy better protect profits while limiting potential losses.
-
Position Sizing: Introduce more advanced position sizing methods, such as the Kelly Criterion or fixed fractional investing. This can help the strategy dynamically adjust positions in different market environments, improving capital utilization efficiency and risk control capabilities.
-
Machine Learning Optimization: Attempt to combine machine learning algorithms with the strategy. Through learning and pattern recognition of historical data, optimize the strategy's parameter selection and signal generation. This can help the strategy automatically adapt to market changes, enhancing its adaptability and robustness.
Conclusion
This article introduced a quantitative trading strategy based on dual moving average crossover and multi-timeframe DMI indicator. The strategy makes trading decisions by capturing market trends while employing risk management measures to control potential losses. The strategy's advantages lie in its ability to effectively identify the main trends in the market and improve signal reliability through multi-timeframe confirmation. However, the strategy also has certain risks, such as parameter optimization, trend delay, choppy markets, and black swan events. To further optimize the strategy, methods such as dynamic parameter adjustment, multi-factor confirmation, stop-loss and take-profit optimization, position sizing, and machine learning can be considered. Overall, this strategy provides quantitative traders with a trend-following trading approach. With reasonable optimization and improvement, it has the potential to achieve good performance in actual trading.
- 1