策略概述
该策略基于三连阳/阴形态和双均线系统,通过判断三根连续K线的实体大小变化和均线系统的交叉信号,在第三根K线收盘时产生买入或卖出信号,以捕捉潜在的趋势拐点和价格反转机会。
策略原理
- 计算连续三根K线的实体大小,判断是否呈现递增趋势。
- 如果连续三根K线实体递增且第三根K线收阳,则产生买入信号;如果连续三根K线实体递增且第三根K线收阴,则产生卖出信号。
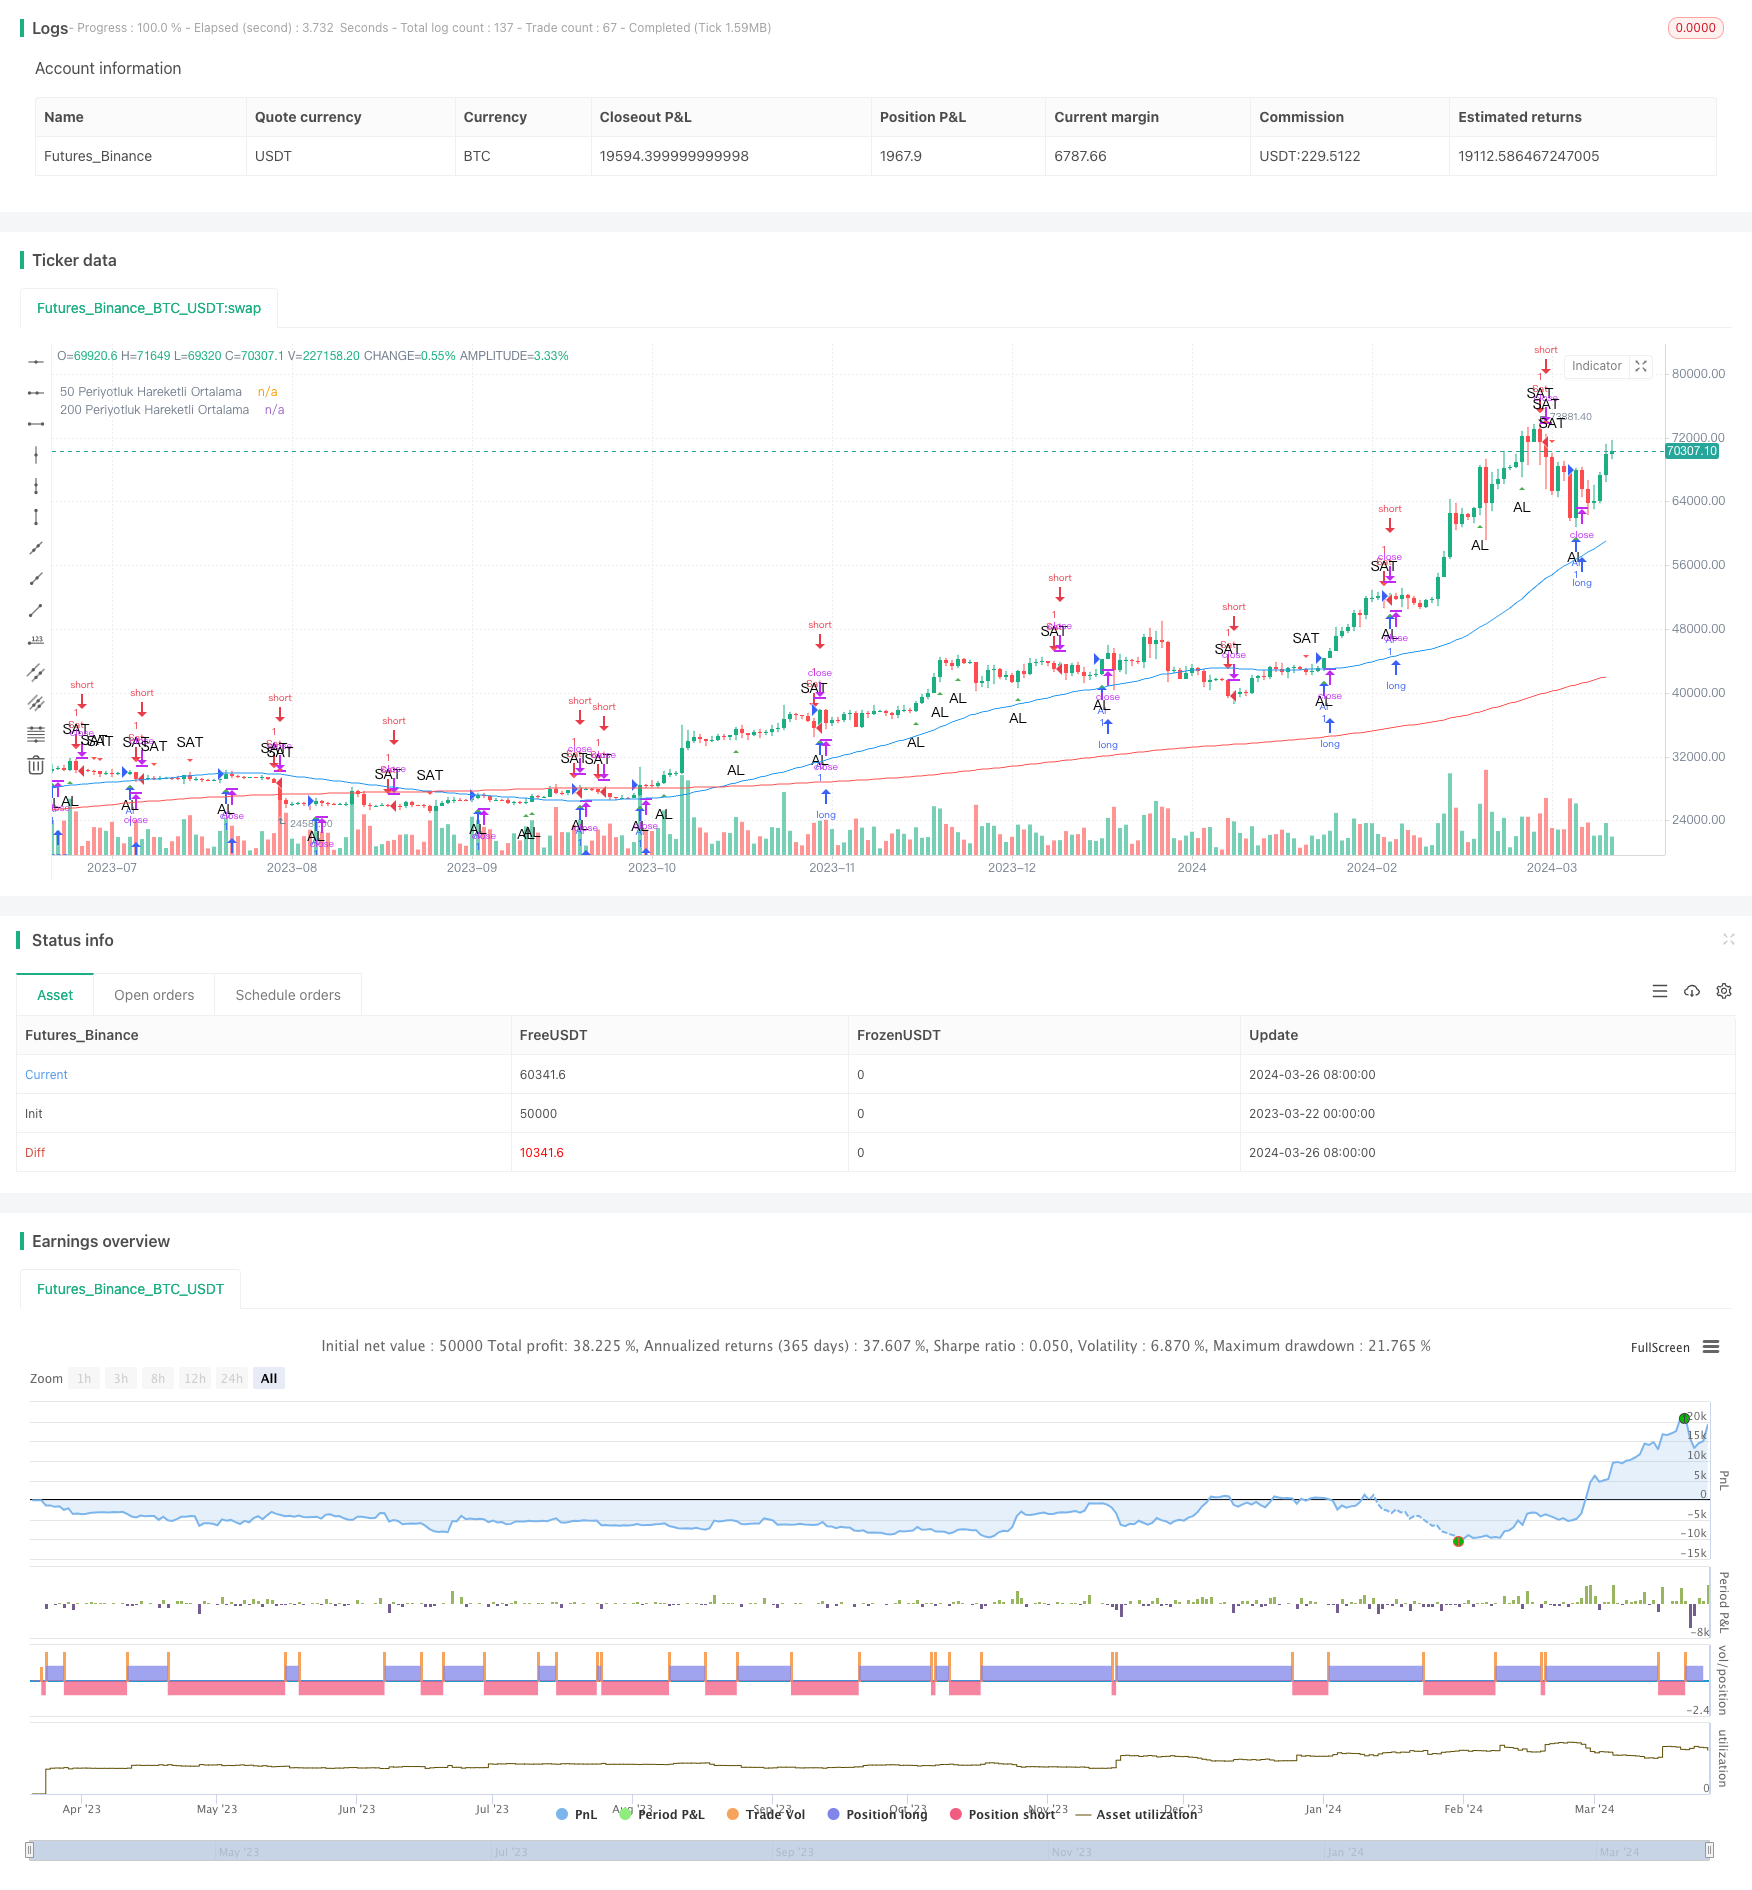
- 引入50日和200日两条移动平均线,分别代表中短期和长期趋势。
- 在图表上标注买卖信号和两条均线,直观展现策略逻辑和趋势状态。
- 根据买卖信号执行相应的开仓操作。
该策略的核心在于通过三连阳/阴形态捕捉趋势启动点,同时利用双均线系统验证趋势强度和方向,两个维度相结合,力求在趋势初期有效入场,降低逆势交易风险。
策略优势
- 三连阳/阴形态是一个强势的看涨/跌信号,代表多/空力量不断增强,为趋势延续提供动能。
- 双均线系统能够有效验证趋势方向和强度,短期均线上穿/下穿长期均线,意味着趋势开始转强/转弱。
- 两个维度相互印证,共同构成较为可靠的开仓信号,有助于提高策略胜率和盈亏比。
- 图表标注直观明了,便于跟踪策略执行情况和趋势演变。
策略风险
- 市场噪音和震荡可能导致频繁的虚假信号,造成策略表现不稳定。
- 趋势突然反转或加速,可能导致策略入场时机不够理想,承担额外风险敞口。
- 缺乏明确的止盈止损和仓位管理规则,策略回撤和最大亏损可能超出预期。
优化方向
- 对三连阳/阴形态的定义进行微调,如考虑连续K线的幅度、长度、颜色等附加条件,提高信号准确性。
- 引入更多均线周期参数,如5日、10日、20日等,构建多重均线系统,丰富趋势判断维度。
- 在开仓信号基础上,设置合理的止盈止损位和仓位管理规则,如固定比例止盈止损、百分比止盈止损、跟踪止损等,控制单次交易风险敞口。
- 考虑加入交易量指标,如量价背离、放量突破等,进一步验证趋势转折点,提高开仓信号可靠性。
策略总结
该策略通过经典的三连阳/阴形态和双均线系统相结合,力求捕捉趋势起始点,博取趋势之初的潜在价差收益。其优势在于信号明确,逻辑简单,易于实现和优化;同时也存在频繁交易、信号不稳定、风险控制不足等潜在风险和改进空间。后续可从信号过滤、仓位管理、止盈止损等方面入手,不断丰富和强化该策略的综合表现,为量化交易实践提供更多参考。
策略源码
/*backtest
start: 2023-03-22 00:00:00
end: 2024-03-27 00:00:00
period: 1d
basePeriod: 1h
exchanges: [{"eid":"Futures_Binance","currency":"BTC_USDT"}]
*/

//@version=4
strategy("Consecutive Candles with MAs", shorttitle="CCMAs", overlay=true)

// Üç ardışık mumun büyüklüklerinin arttığını kontrol eden fonksiyon
isThreeConsecutiveCandlesIncreasing() =>
    firstCandleBody = abs(close[2] - open[2])
    secondCandleBody = abs(close[1] - open[1])
    thirdCandleBody = abs(close - open)
    firstCandleBody < secondCandleBody and secondCandleBody < thirdCandleBody

// Üçüncü mum kapandığında al veya sat koşulu
longCondition = isThreeConsecutiveCandlesIncreasing() and close > open
shortCondition = isThreeConsecutiveCandlesIncreasing() and close < open

// 50 ve 200 periyotluk hareketli ortalamalar
ma50 = sma(close, 50)
ma200 = sma(close, 200)

// Al veya sat sinyallerini grafiğe ekleme
plotshape(series=longCondition, title="Al Sinyali", location=location.belowbar, color=color.green, style=shape.triangleup, text="AL")
plotshape(series=shortCondition, title="Sat Sinyali", location=location.abovebar, color=color.red, style=shape.triangledown, text="SAT")

// Hareketli ortalamaların grafiğe eklenmesi
plot(ma50, title="50 Periyotluk Hareketli Ortalama", color=color.blue)
plot(ma200, title="200 Periyotluk Hareketli Ortalama", color=color.red)

// Al veya sat komutlarını çalıştırma
if (longCondition)
    strategy.entry("Al", strategy.long)
if (shortCondition)
    strategy.entry("Sat", strategy.short)