Exponential Moving Average Crossover Quantitative Trading Strategy

Overview
This strategy uses the crossover of two exponential moving averages (EMAs) as buy and sell signals. When the shorter-period EMA crosses above the longer-period EMA from below, it generates a buy signal; conversely, when the shorter-period EMA crosses below the longer-period EMA from above, it generates a sell signal. Additionally, the strategy determines whether the crossover point is the highest or lowest price within the last 10 trading periods to confirm the strength of the trend. If the crossover point is the highest price, the background will be colored green; if it is the lowest price, it will be colored red. Furthermore, the strategy displays the price of the crossover point on the chart.
Strategy Principles
- Calculate two EMAs with different periods, with default periods of 5 and 10.
- Determine whether the two EMAs cross over. If the short-term EMA crosses above the long-term EMA from below, it generates a buy signal; if the short-term EMA crosses below the long-term EMA from above, it generates a sell signal.
- When a crossover signal occurs, determine whether the current crossover point is the highest or lowest price within the last 10 trading periods. If it is the highest price, the upward trend is considered strong; if it is the lowest price, the downward trend is considered strong.
- If a buy signal is generated and there is no current position, open a long position; if a sell signal is generated and there is no current position, open a short position.
- If a long position is held and the short-term EMA crosses below the long-term EMA from above, close the long position; if a short position is held and the short-term EMA crosses above the long-term EMA from below, close the short position.
Strategy Advantages
- Exponential moving averages react faster to price changes compared to simple moving averages, thus generating more timely trading signals.
- By determining whether the crossover point is the recent highest or lowest price, it can filter out trading opportunities with greater trend strength and improve strategy profitability.
- Marking the crossover point price on the chart provides traders with more intuitive trading references.
- The code logic is clear and easy to understand and implement.
Strategy Risks
- The signals generated by EMA crossovers may have a delay, leading to missing the best trading opportunities.
- In a fluctuating market, EMA crossovers may occur frequently, resulting in excessive trading frequency and increased trading costs.
- The strategy lacks stop-loss measures, so if the judgment is wrong, it may face a greater drawdown risk.
Strategy Optimization Directions
- Introduce more technical indicators, such as RSI, MACD, etc., to assist in judging trend strength and direction, and improve signal accuracy.
- Set reasonable stop-loss and take-profit levels to control single-trade risk.
- Optimize trading parameters, such as EMA periods and crossover confirmation time windows, to improve strategy adaptability.
- Combine market sentiment indicators, such as VIX, to filter trading signals and reduce false signals.
- Consider adding position management and capital management modules to dynamically adjust the amount of funds for each trade and improve capital utilization efficiency.
Summary
This strategy uses exponential moving average crossovers as its core logic, while also considering the relative position of the crossover point price in the recent period to determine trend strength. Overall, the strategy logic is clear, and the advantages are obvious, but it also has certain limitations and risks. By introducing more auxiliary judgment indicators, setting reasonable risk control measures, and optimizing key parameters, the stability and profitability of this strategy can be further improved.
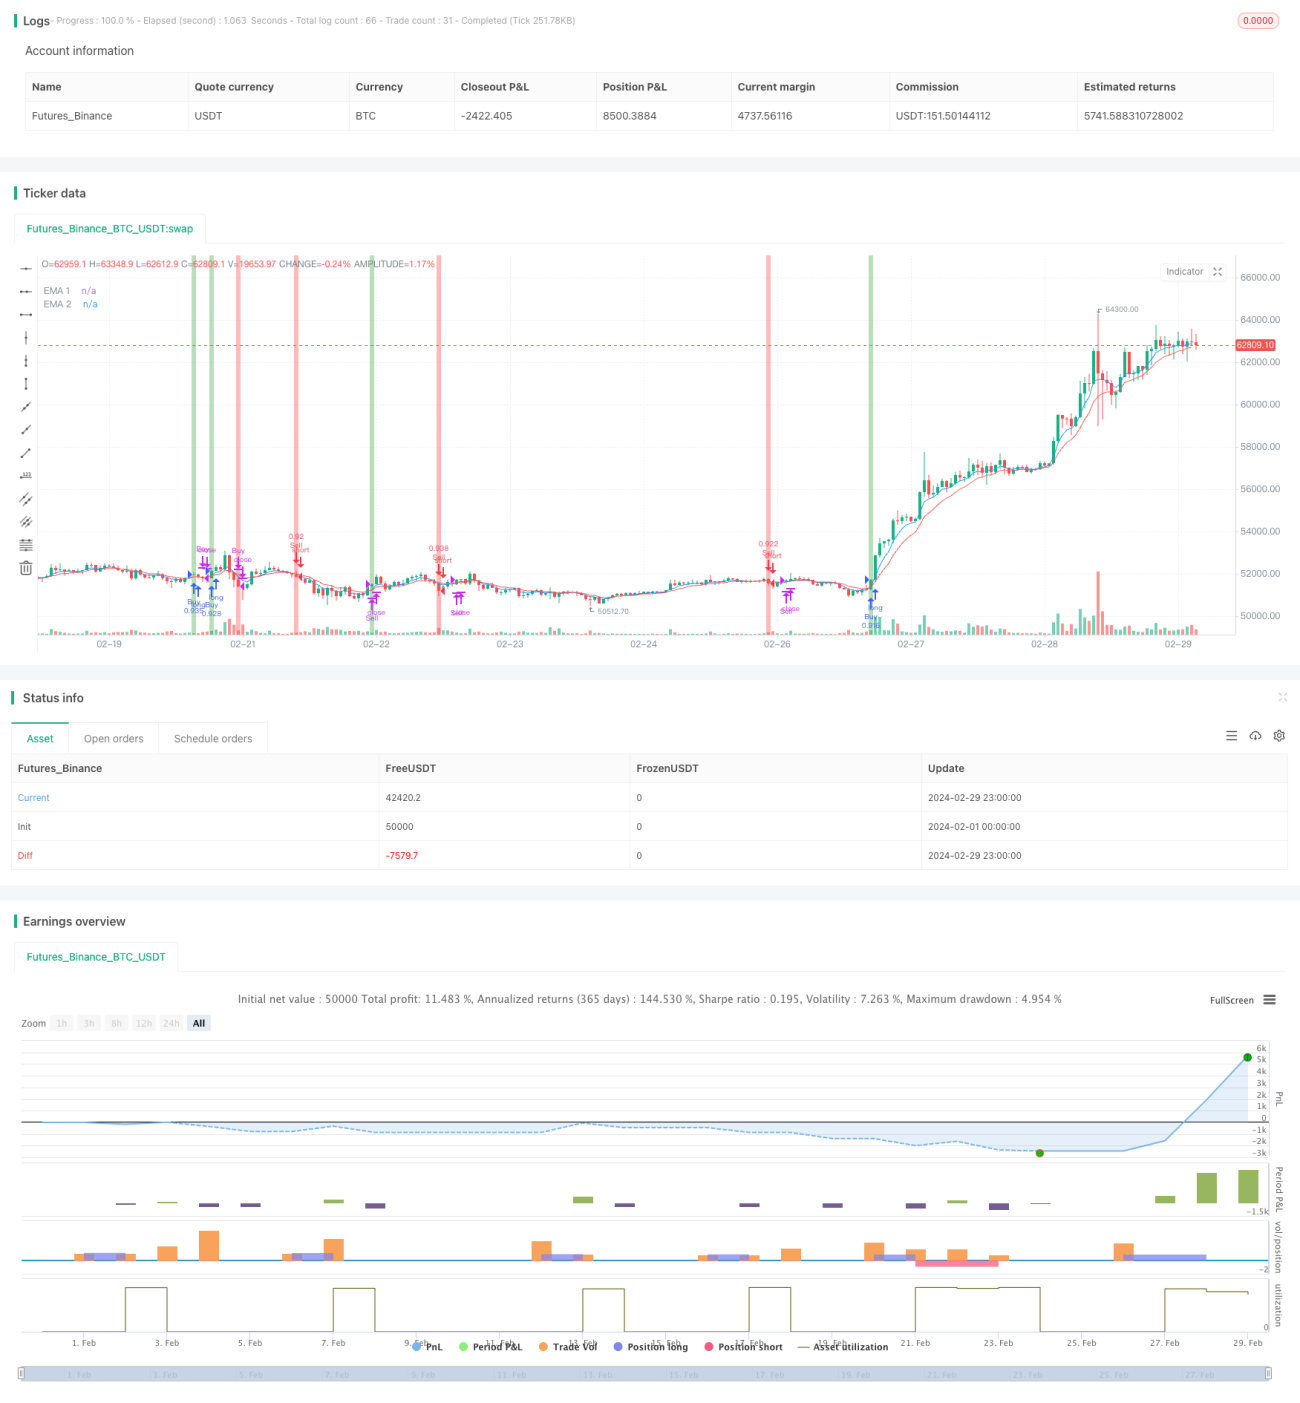
/*backtest
start: 2024-02-01 00:00:00
end: 2024-02-29 23:59:59
period: 1h
basePeriod: 15m
exchanges: [{"eid":"Futures_Binance","currency":"BTC_USDT"}]
*/

// This source code is subject to the terms of the Mozilla Public License 2.0 at https://mozilla.org/MPL/2.0/
// © ZenAndTheArtOfTrading
// @version=5
strategy("ema giao nhau", overlay=true, default_qty_type=strategy.percent_of_equity, default_qty_value=100)- 1