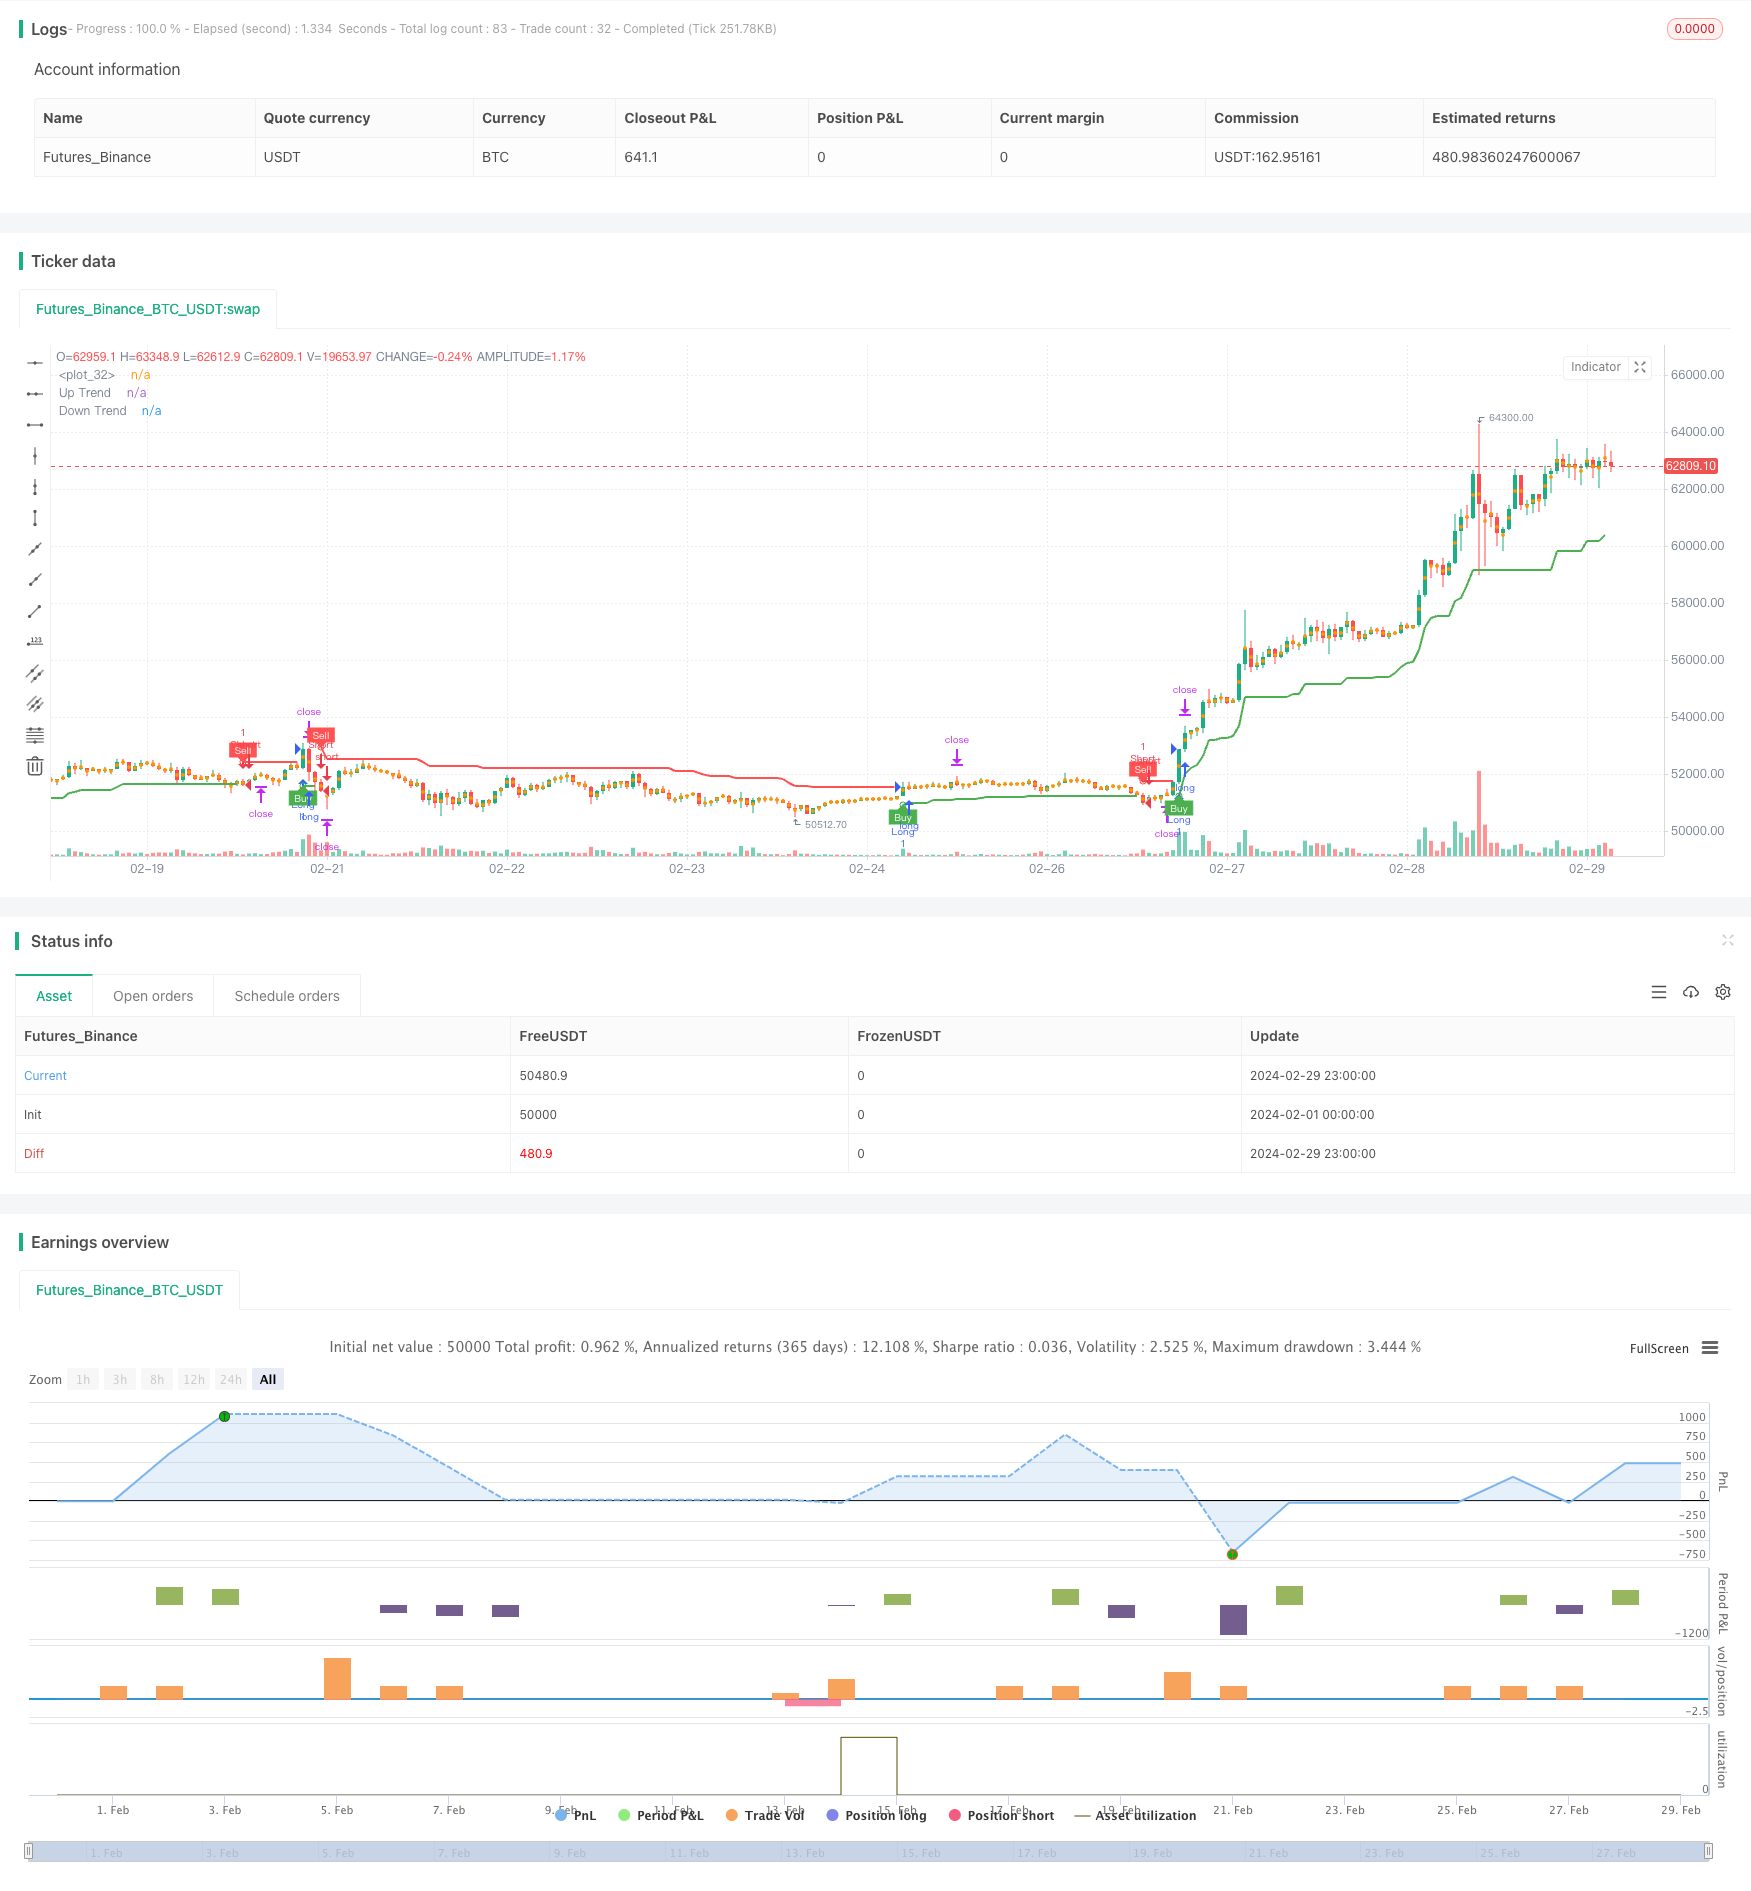
概述
这是一个基于超级趋势指标和ATR指标的策略。该策略的主要思路是:利用超级趋势指标判断当前市场的趋势方向,当超级趋势指标发生变化时进行交易。同时,该策略使用ATR指标计算止损和止盈价格,并根据账户余额的一定比例计算仓位大小,以控制风险。
策略原理
该策略的原理如下: 1. 计算超级趋势指标的值,当超级趋势指标发生变化时,产生买入或卖出信号。 2. 使用ATR指标计算止损和止盈价格,止损价格为当前价格加减ATR值乘以一个倍数,止盈价格为止损价格乘以一个风险收益比。 3. 根据账户余额的一定比例和止损价格计算仓位大小,以控制每笔交易的风险。 4. 当产生买入信号时,开仓做多,止损价格为信号产生时的价格减去ATR值乘以一个倍数,止盈价格为信号产生时的价格加上ATR值乘以一个倍数乘以风险收益比。 5. 当产生卖出信号时,开仓做空,止损价格为信号产生时的价格加上ATR值乘以一个倍数,止盈价格为信号产生时的价格减去ATR值乘以一个倍数乘以风险收益比。
策略优势
该策略的优势如下: 1. 结合了趋势跟踪和波动率指标,能够有效捕捉趋势,同时控制风险。 2. 仓位大小根据账户余额和风险程度自动计算,无需手动调整,易于实施。 3. 参数可以灵活调整,适用于不同的市场和品种。
策略风险
该策略的风险如下: 1. 在震荡市场中,频繁的买卖信号可能导致较高的交易成本和滑点。 2. 固定的止损和止盈比例可能无法适应市场的变化,导致止损过早或者利润太小。 3. 仓位大小的计算依赖于历史波动率,在波动率突然放大时,可能导致较大的回撤。
针对以上风险,可以采取以下措施: 1. 增加信号过滤条件,减少交易频率。 2. 优化止损和止盈的计算方法,例如使用移动止损或者动态止盈。 3. 在仓位计算中引入风险控制因子,例如波动率突破时减少仓位。
策略优化方向
该策略可以在以下方面进行优化: 1. 引入更多的技术指标,例如MACD、RSI等,作为趋势判断和信号过滤的辅助条件,提高信号的准确性。 2. 对于不同的市场和品种,优化超级趋势指标和ATR指标的参数,找到最佳的参数组合。 3. 在仓位计算中引入更多的风险控制因素,例如账户最大回撤、单笔交易最大风险等,提高策略的稳健性。 4. 增加止盈策略,例如部分止盈、移动止盈等,让利润持续增长。
以上优化可以提高策略的盈利能力和稳定性,同时降低策略的风险,使策略更加适应不同的市场环境。
总结
该策略结合了超级趋势指标和ATR指标,能够有效捕捉趋势,同时控制风险。通过计算最佳仓位大小,使得每笔交易的风险是可控的。但是该策略在震荡市场中可能会产生较高的交易成本和回撤。通过引入更多的技术指标、优化参数、增加风险控制因素和改进止盈策略,可以进一步提高该策略的性能。总的来说,该策略是一个简单有效的趋势跟踪策略,适合在趋势市场中使用。
/*backtest
start: 2024-02-01 00:00:00
end: 2024-02-29 23:59:59
period: 1h
basePeriod: 15m
exchanges: [{"eid":"Futures_Binance","currency":"BTC_USDT"}]
*/

// This Pine Script™ code is subject to the terms of the Mozilla Public License 2.0 at https://mozilla.org/MPL/2.0/
// © tradez99

//@version=5
strategy('Supertrend', overlay=true, format=format.price, precision=2)

Periods = input(title='ATR Period', defval=10)
src = input(hl2, title='Source')
Multiplier = input.float(title='ATR Multiplier', step=0.1, defval=3.0)
changeATR = input(title='Change ATR Calculation Method ?', defval=true)
showsignals = input(title='Show Buy/Sell Signals ?', defval=true)
highlighting = input(title='Highlighter On/Off ?', defval=true)
atr2 = ta.sma(ta.tr, Periods)
atr = changeATR ? ta.atr(Periods) : atr2
up = src - Multiplier * atr
up1 = nz(up[1], up)
up := close[1] > up1 ? math.max(up, up1) : up
dn = src + Multiplier * atr
dn1 = nz(dn[1], dn)
dn := close[1] < dn1 ? math.min(dn, dn1) : dn
trend = 1
trend := nz(trend[1], trend)
trend := trend == -1 and close > dn1 ? 1 : trend == 1 and close < up1 ? -1 : trend
upPlot = plot(trend == 1 ? up : na, title='Up Trend', style=plot.style_linebr, linewidth=2, color=color.new(color.green, 0))
buySignal = trend == 1 and trend[1] == -1
plotshape(buySignal ? up : na, title='UpTrend Begins', location=location.absolute, style=shape.circle, size=size.tiny, color=color.new(color.green, 0))
plotshape(buySignal and showsignals ? up : na, title='Buy', text='Buy', location=location.absolute, style=shape.labelup, size=size.tiny, color=color.new(color.green, 0), textcolor=color.new(color.white, 0))
dnPlot = plot(trend == 1 ? na : dn, title='Down Trend', style=plot.style_linebr, linewidth=2, color=color.new(color.red, 0))
sellSignal = trend == -1 and trend[1] == 1
plotshape(sellSignal ? dn : na, title='DownTrend Begins', location=location.absolute, style=shape.circle, size=size.tiny, color=color.new(color.red, 0))
plotshape(sellSignal and showsignals ? dn : na, title='Sell', text='Sell', location=location.absolute, style=shape.labeldown, size=size.tiny, color=color.new(color.red, 0), textcolor=color.new(color.white, 0))
mPlot = plot(ohlc4, title='', style=plot.style_circles, linewidth=0)
longFillColor = highlighting ? trend == 1 ? color.green : color.white : color.white
shortFillColor = highlighting ? trend == -1 ? color.red : color.white : color.white
//fill(mPlot, upPlot, title='UpTrend Highligter', color=longFillColor)
//fill(mPlot, dnPlot, title='DownTrend Highligter', color=shortFillColor)

multiplier = input.float(title="ATR multiplier", defval = 1.5)
rr           = input.float(title="Risk:Reward", defval=1.0)
riskPerTrade = input.float(title="Risk Per Trade %", defval=1.0)
atr3 = ta.atr(14)

//calculate stops and targets
longstop = close - (atr3 * multiplier)
shortstop = close + (atr3 * multiplier)
longStopDistance  = close - longstop
shortStopDistance = shortstop - close
longTarget  = close + (longStopDistance * rr)
shortTarget = close - (shortStopDistance * rr)

// Save stops & targets
var t_stop = 0.0
var t_target = 0.0

longCondition = buySignal
if (longCondition)
    t_stop := longstop
    t_target := longTarget
    positionSize = math.floor((strategy.equity * (riskPerTrade/100)) / (close - t_stop))
    strategy.entry("Long", strategy.long, qty = positionSize)

shortCondition = sellSignal
if (shortCondition)
    t_stop := shortstop
    t_target := shortTarget
    positionSize = math.floor((strategy.equity * (riskPerTrade/100)) / (t_stop - close))
    strategy.entry("Short", strategy.short, qty = positionSize)

strategy.exit(id="Long Exit", from_entry="Long", limit=t_target, stop=t_stop)
strategy.exit(id="Short Exit", from_entry="Short", limit=t_target, stop=t_stop)