BreakHigh EMA Crossover Strategy

Overview
The BreakHigh EMA Crossover Strategy is a trading strategy based on price breakout and Exponential Moving Average (EMA) crossover. The strategy uses the highest price within a specified period as the buy signal and the EMA as the sell signal. When the closing price breaks above the highest price within the specified period, the strategy generates a buy signal. When the closing price falls below the EMA, the strategy generates a sell signal. The strategy also sets a stop-loss price to control risk. Additionally, the strategy provides multiple parameters for users to customize to adapt to different trading styles and market conditions.
Strategy Principle
The core principle of the BreakHigh EMA Crossover Strategy is to capture market trends using price breakout and EMA crossover. When the price breaks above the highest price within a specified period, it indicates that the market may enter an uptrend, so the strategy generates a buy signal. At the same time, the EMA serves as a trend-following indicator. When the price falls below the EMA, it indicates that the uptrend may end, so the strategy generates a sell signal.
The strategy uses the following steps to implement trading:
- Calculate the highest price within the specified period as the breakout buy price.
- Calculate the EMA as the sell signal.
- When the closing price breaks above the breakout buy price, if there is no current position, the strategy generates a buy signal.
- When the closing price falls below the EMA, if there is a current position, the strategy generates a sell signal.
- Calculate the lowest price within the specified period as the stop-loss price.
- If the price falls below the stop-loss price, the strategy immediately closes the position.
Through the above steps, the strategy can profit from the rising trend in the market while using stop-loss to control downside risk.
Strategy Advantages
The BreakHigh EMA Crossover Strategy has the following advantages:
- Trend tracking: The strategy uses price breakout and EMA crossover to capture market trends and can profit from uptrends.
- Risk control: The strategy uses a stop-loss price to control downside risk, which can effectively reduce the maximum drawdown of the strategy.
- Parameter flexibility: The strategy provides multiple parameters for users to customize, such as period, risk ratio, whether to use stop-loss, etc., which can be adjusted according to different trading styles and market conditions.
- Simple and effective: The strategy logic is simple and clear, easy to understand and implement, and can achieve good returns in trending markets.
Strategy Risks
Although the BreakHigh EMA Crossover Strategy has certain advantages, it also has the following risks:
- Market volatility risk: In cases of high market volatility, the strategy may generate more false signals, leading to frequent trading and capital losses.
- Trend reversal risk: When the market trend reverses, the strategy may delay selling, resulting in profit retracement or turning profits into losses.
- Parameter setting risk: The performance of the strategy depends on the setting of parameters, such as period, risk ratio, etc. If the parameters are set improperly, it may lead to poor performance of the strategy.
To mitigate these risks, the following measures can be considered:
- Properly adjust parameters: According to different market conditions and trading instruments, properly adjust strategy parameters, such as increasing the period, reducing the risk ratio, etc., to reduce false signals and frequent trading.
- Combine with other indicators: Combine with other technical indicators, such as RSI, MACD, etc., to confirm the validity of trends and signals and improve the reliability of the strategy.
- Set reasonable stop-loss: Set a reasonable stop-loss price, which can control downside risk and not stop loss too early, resulting in missed profit opportunities.
Strategy Optimization Directions
To further improve the performance of the BreakHigh EMA Crossover Strategy, the following optimization directions can be considered:
- Dynamic parameter adjustment: According to market volatility and trend strength, dynamically adjust strategy parameters, such as increasing the period when volatility is high, increasing the risk ratio when the trend is strong, etc., to adapt to different market conditions.
- Introduce long-short mechanism: On the basis of the original long trading, introduce a short trading mechanism to profit from downtrends as well, improving the adaptability and profitability of the strategy.
- Optimize stop-loss and take-profit: Optimize the setting of stop-loss and take-profit, such as using trailing stop-loss, partial take-profit, etc., to better control risks and lock in profits.
- Combine with fundamental analysis: Combine fundamental analysis with technical analysis, such as adjusting the position and parameters of the strategy before and after important events such as corporate earnings reports and economic data releases, to cope with possible market changes.
Through the above optimization measures, the stability, adaptability, and profitability of the BreakHigh EMA Crossover Strategy can be improved, enabling it to achieve good performance in more market environments.
Summary
The BreakHigh EMA Crossover Strategy is a simple and effective trend-following strategy that captures market trends by using price breakout and EMA crossover while using stop-loss to control downside risk. The strategy logic is clear, parameters are flexible, and it is easy to understand and implement. Although the strategy has certain risks, such as market volatility risk, trend reversal risk, and parameter setting risk, these risks can be mitigated through appropriate risk control measures, such as adjusting parameters, combining with other indicators, and setting reasonable stop-loss. In addition, the strategy has further optimization space, such as dynamic parameter adjustment, introducing long-short mechanism, optimizing stop-loss and take-profit, and combining with fundamental analysis, etc., to improve the performance and adaptability of the strategy. Overall, the BreakHigh EMA Crossover Strategy is a quantitative trading strategy worth trying and optimizing.
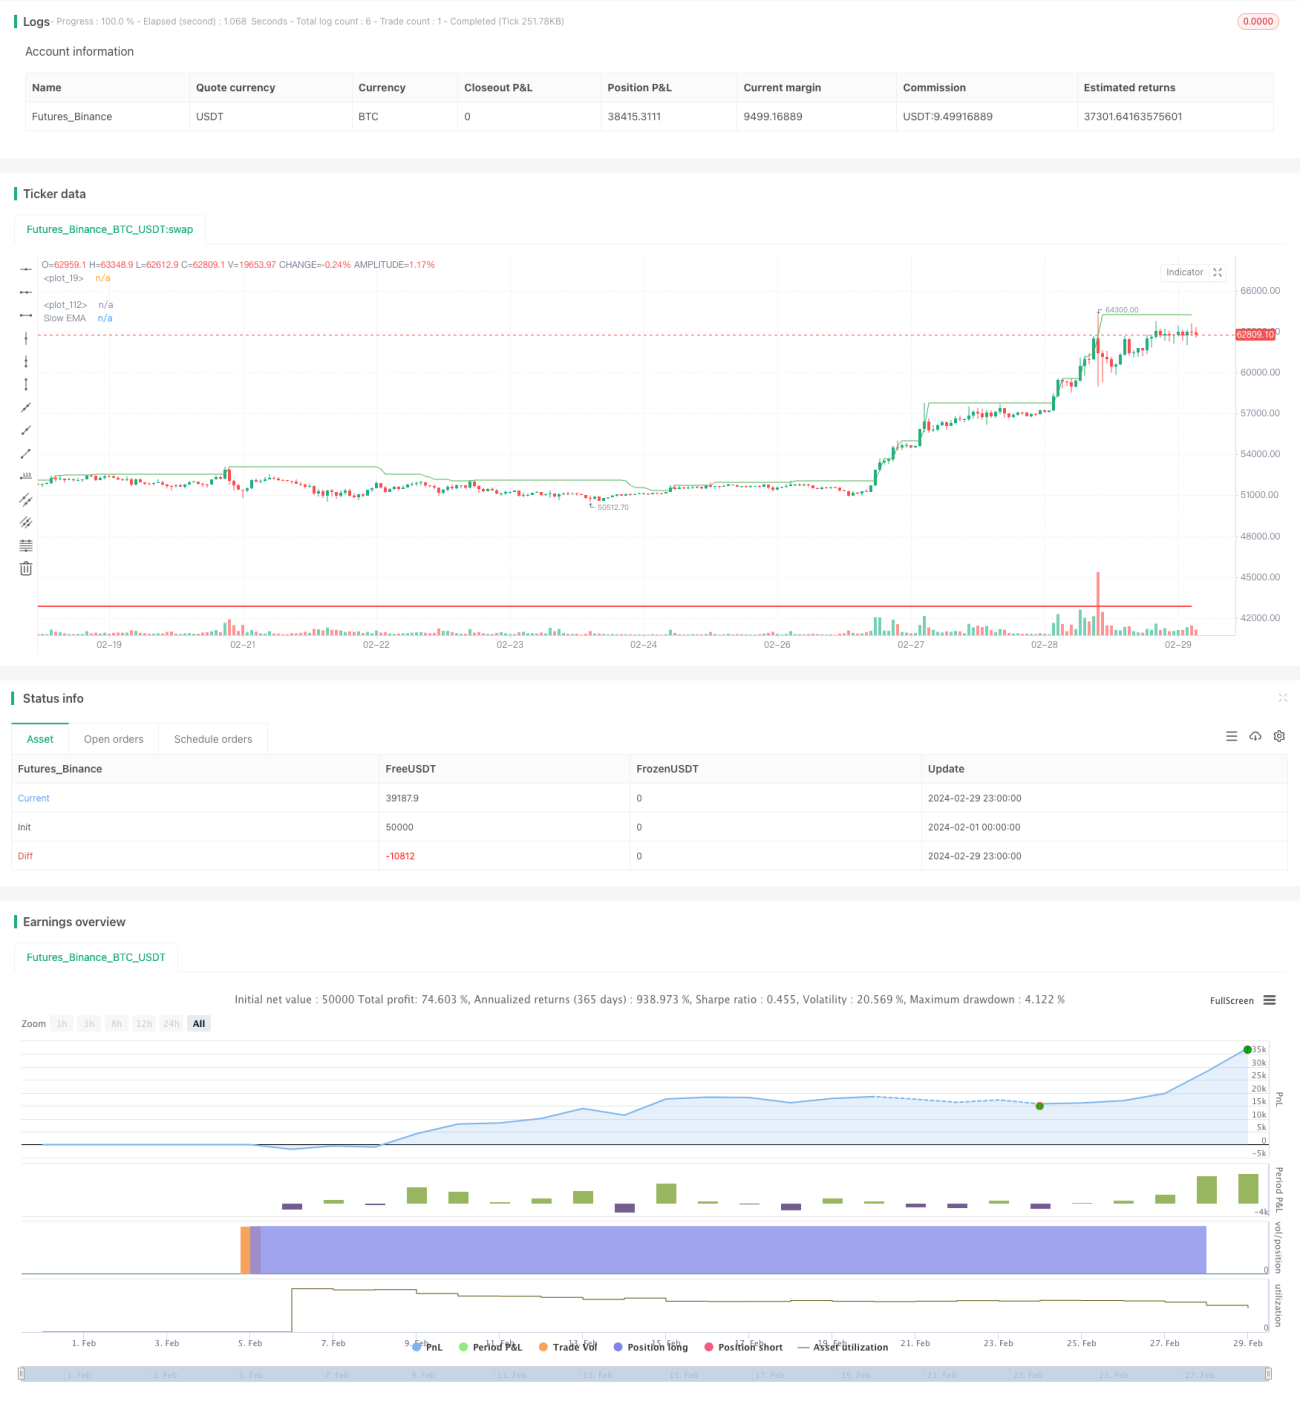
/*backtest
start: 2024-02-01 00:00:00
end: 2024-02-29 23:59:59
period: 1h
basePeriod: 15m
exchanges: [{"eid":"Futures_Binance","currency":"BTC_USDT"}]
*/

// @version = 5
strategy(title="BreakHigh Strategy", overlay=true)
Period = input.int(34, "Number of previous bars(34,52 Recommend)")
showbg = input(defval = false,title = "Show BackGround Color")- 1