
Overview
This strategy is a trend-following variable position grid strategy that mainly uses EMA, RSI, and engulfing patterns to determine the trend direction and entry timing. The strategy adjusts the stop-loss and take-profit positions based on the size of the engulfing pattern's body while allowing users to choose to go long only, short only, or both. Additionally, the strategy provides the option to use MACD as a trend filter.
Strategy Principles
The strategy uses a 200-period EMA to determine the overall trend direction. When the price is above the EMA, it is considered an uptrend, and when below the EMA, it is considered a downtrend. A 9-period RSI is used to gauge momentum, with an RSI above 50 indicating stronger bullish momentum and below 50 indicating stronger bearish momentum. The strategy also uses bullish and bearish engulfing patterns as entry signals. When the EMA, RSI, and engulfing pattern signals are in agreement, the strategy opens a position.
The stop-loss and take-profit positions are determined based on the size of the engulfing pattern's body. The stop-loss is set at twice the size of the engulfing body, with a minimum stop-loss percentage of 0.3% from the entry price to avoid frequent stop-outs due to small stop-loss distances. The take-profit position is set by multiplying the stop-loss distance by a pre-defined risk-reward ratio to ensure a fixed risk-reward ratio. Additionally, the strategy provides the option to use MACD as a trend filter, considering a stronger bullish trend when the MACD line is above the signal line and a stronger bearish trend when the MACD line is below the signal line.
Strategy Advantages
-
Trend following: The strategy uses multiple indicators to determine the trend, helping to enter at the early stages of a trend formation and capture trending moves.
-
Dynamic stop-loss and take-profit: By adjusting the stop-loss and take-profit positions based on the size of the engulfing pattern's body, the strategy expands the take-profit range when the trend is strong and narrows the stop-loss range when the trend is weak, allowing for flexible position management.
-
Users can customize trading direction, risk preferences, and other parameters to suit different user needs.
-
The option to use MACD as a trend filter further confirms trend strength and improves entry accuracy.
Strategy Risks
-
Incorrect trend identification: Although the strategy uses multiple indicators to determine the trend, there may still be instances where the trend is incorrectly identified, leading to losses.
-
Narrowing range: If the engulfing pattern's body is small, the stop-loss and take-profit distances will be very close, leading to a deterioration in the risk-reward ratio. This situation is more common in choppy markets.
-
Parameter optimization: The optimal parameters may vary significantly across different instruments and timeframes, requiring users to continuously test and optimize.
Strategy Optimization Directions
-
Trend identification: Consider introducing additional trend confirmation tools such as Bollinger Bands, Average Directional Index (ADX), etc., to improve the accuracy of trend identification.
-
Stop-loss and take-profit optimization: Consider incorporating volatility-related indicators such as ATR to dynamically adjust stop-loss and take-profit distances, reducing the risk associated with small ranges.
-
Position sizing: Dynamically adjust position size based on trend strength, account profitability, etc., increasing position size when the trend is strong and consistently profitable, and reducing the cost of frequent trading.
-
Multi-timeframe and multi-instrument coordination: Validate trend signals across timeframes and instruments to improve the accuracy of trend identification while diversifying the risk of a single instrument or timeframe.
Summary
This trend-following variable position grid strategy performs well in trending markets by using multiple indicators to determine trend direction and strength, dynamically adjusting stop-loss, take-profit, and position sizing to capture trends and achieve excess returns. However, the strategy's performance is average in unclear or frequently fluctuating markets. Therefore, when using this strategy, it is crucial to focus on selecting trending instruments and adjusting parameters as market conditions change. Furthermore, there is room for further optimization in trend identification, stop-loss and take-profit placement, position sizing, and multi-timeframe and multi-instrument coordination.
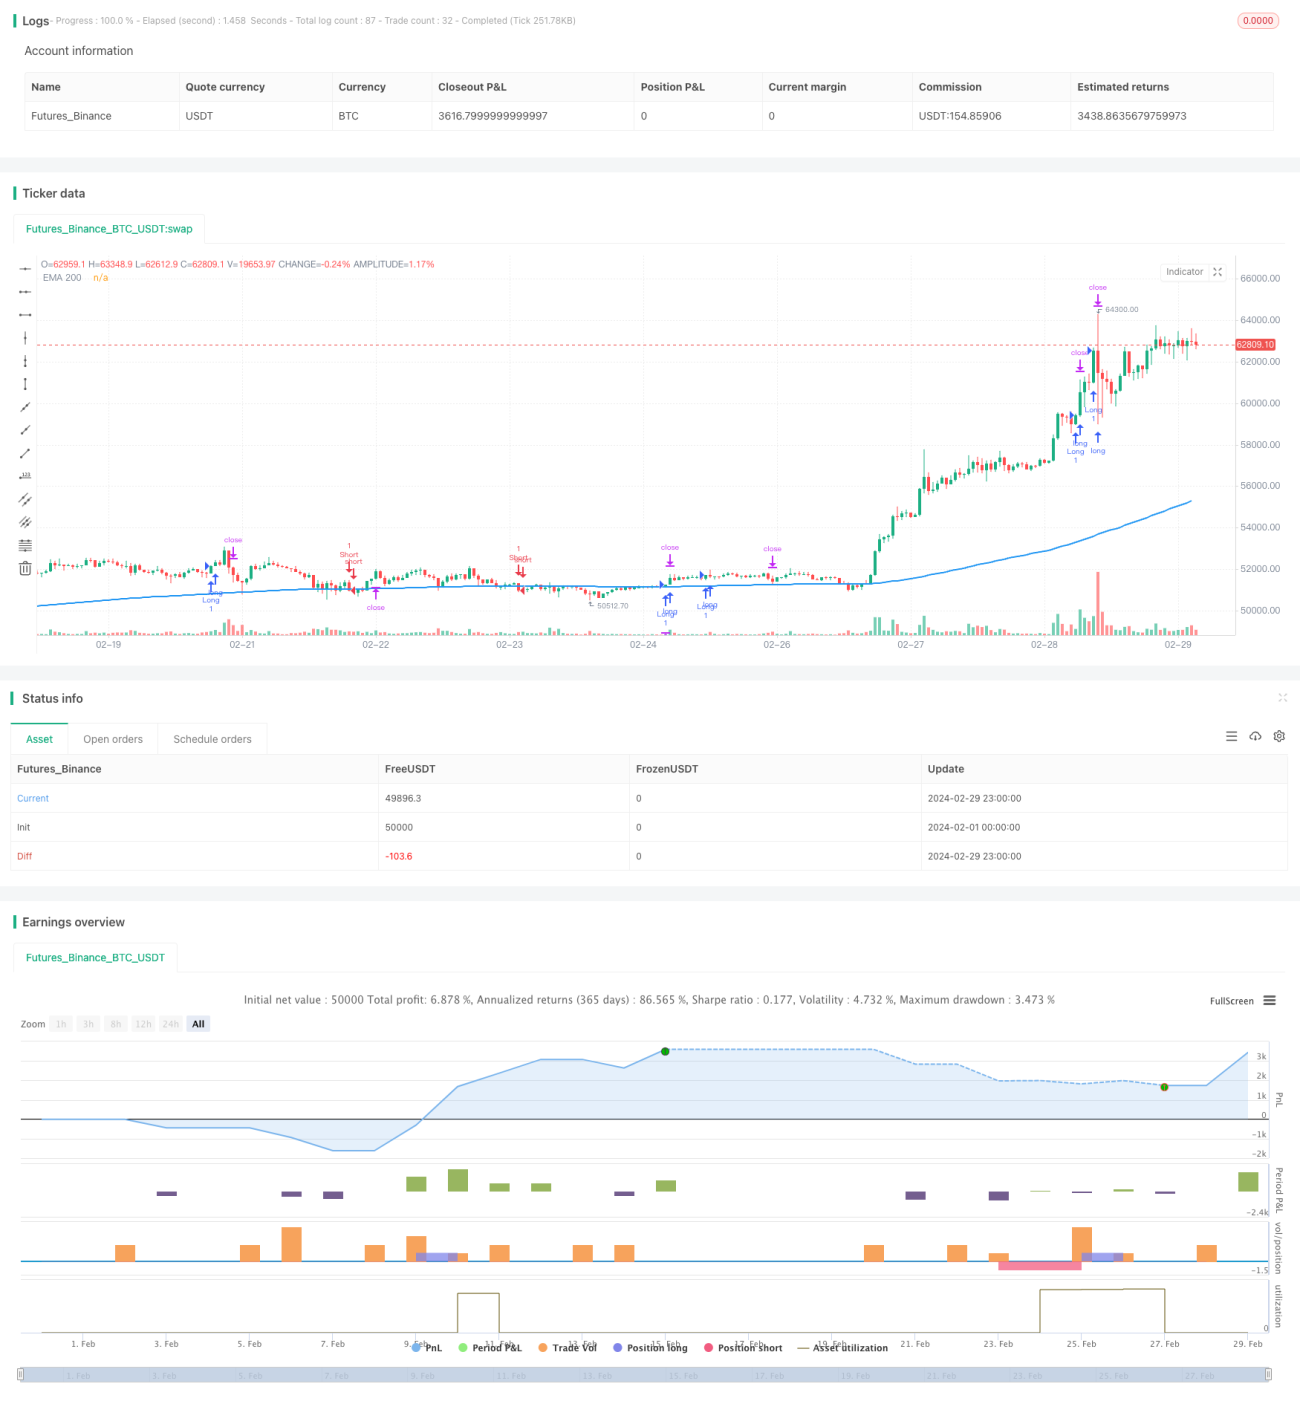
/*backtest
start: 2024-02-01 00:00:00
end: 2024-02-29 23:59:59
period: 1h
basePeriod: 15m
exchanges: [{"eid":"Futures_Binance","currency":"BTC_USDT"}]
*/

// This Pine Script™ code is subject to the terms of the Mozilla Public License 2.0 at https://mozilla.org/MPL/2.0/
// © niosupetranmartinez
//@version=5
strategy("Trend Follower Scalping Strategy", overlay=true, process_orders_on_close = true)- 1