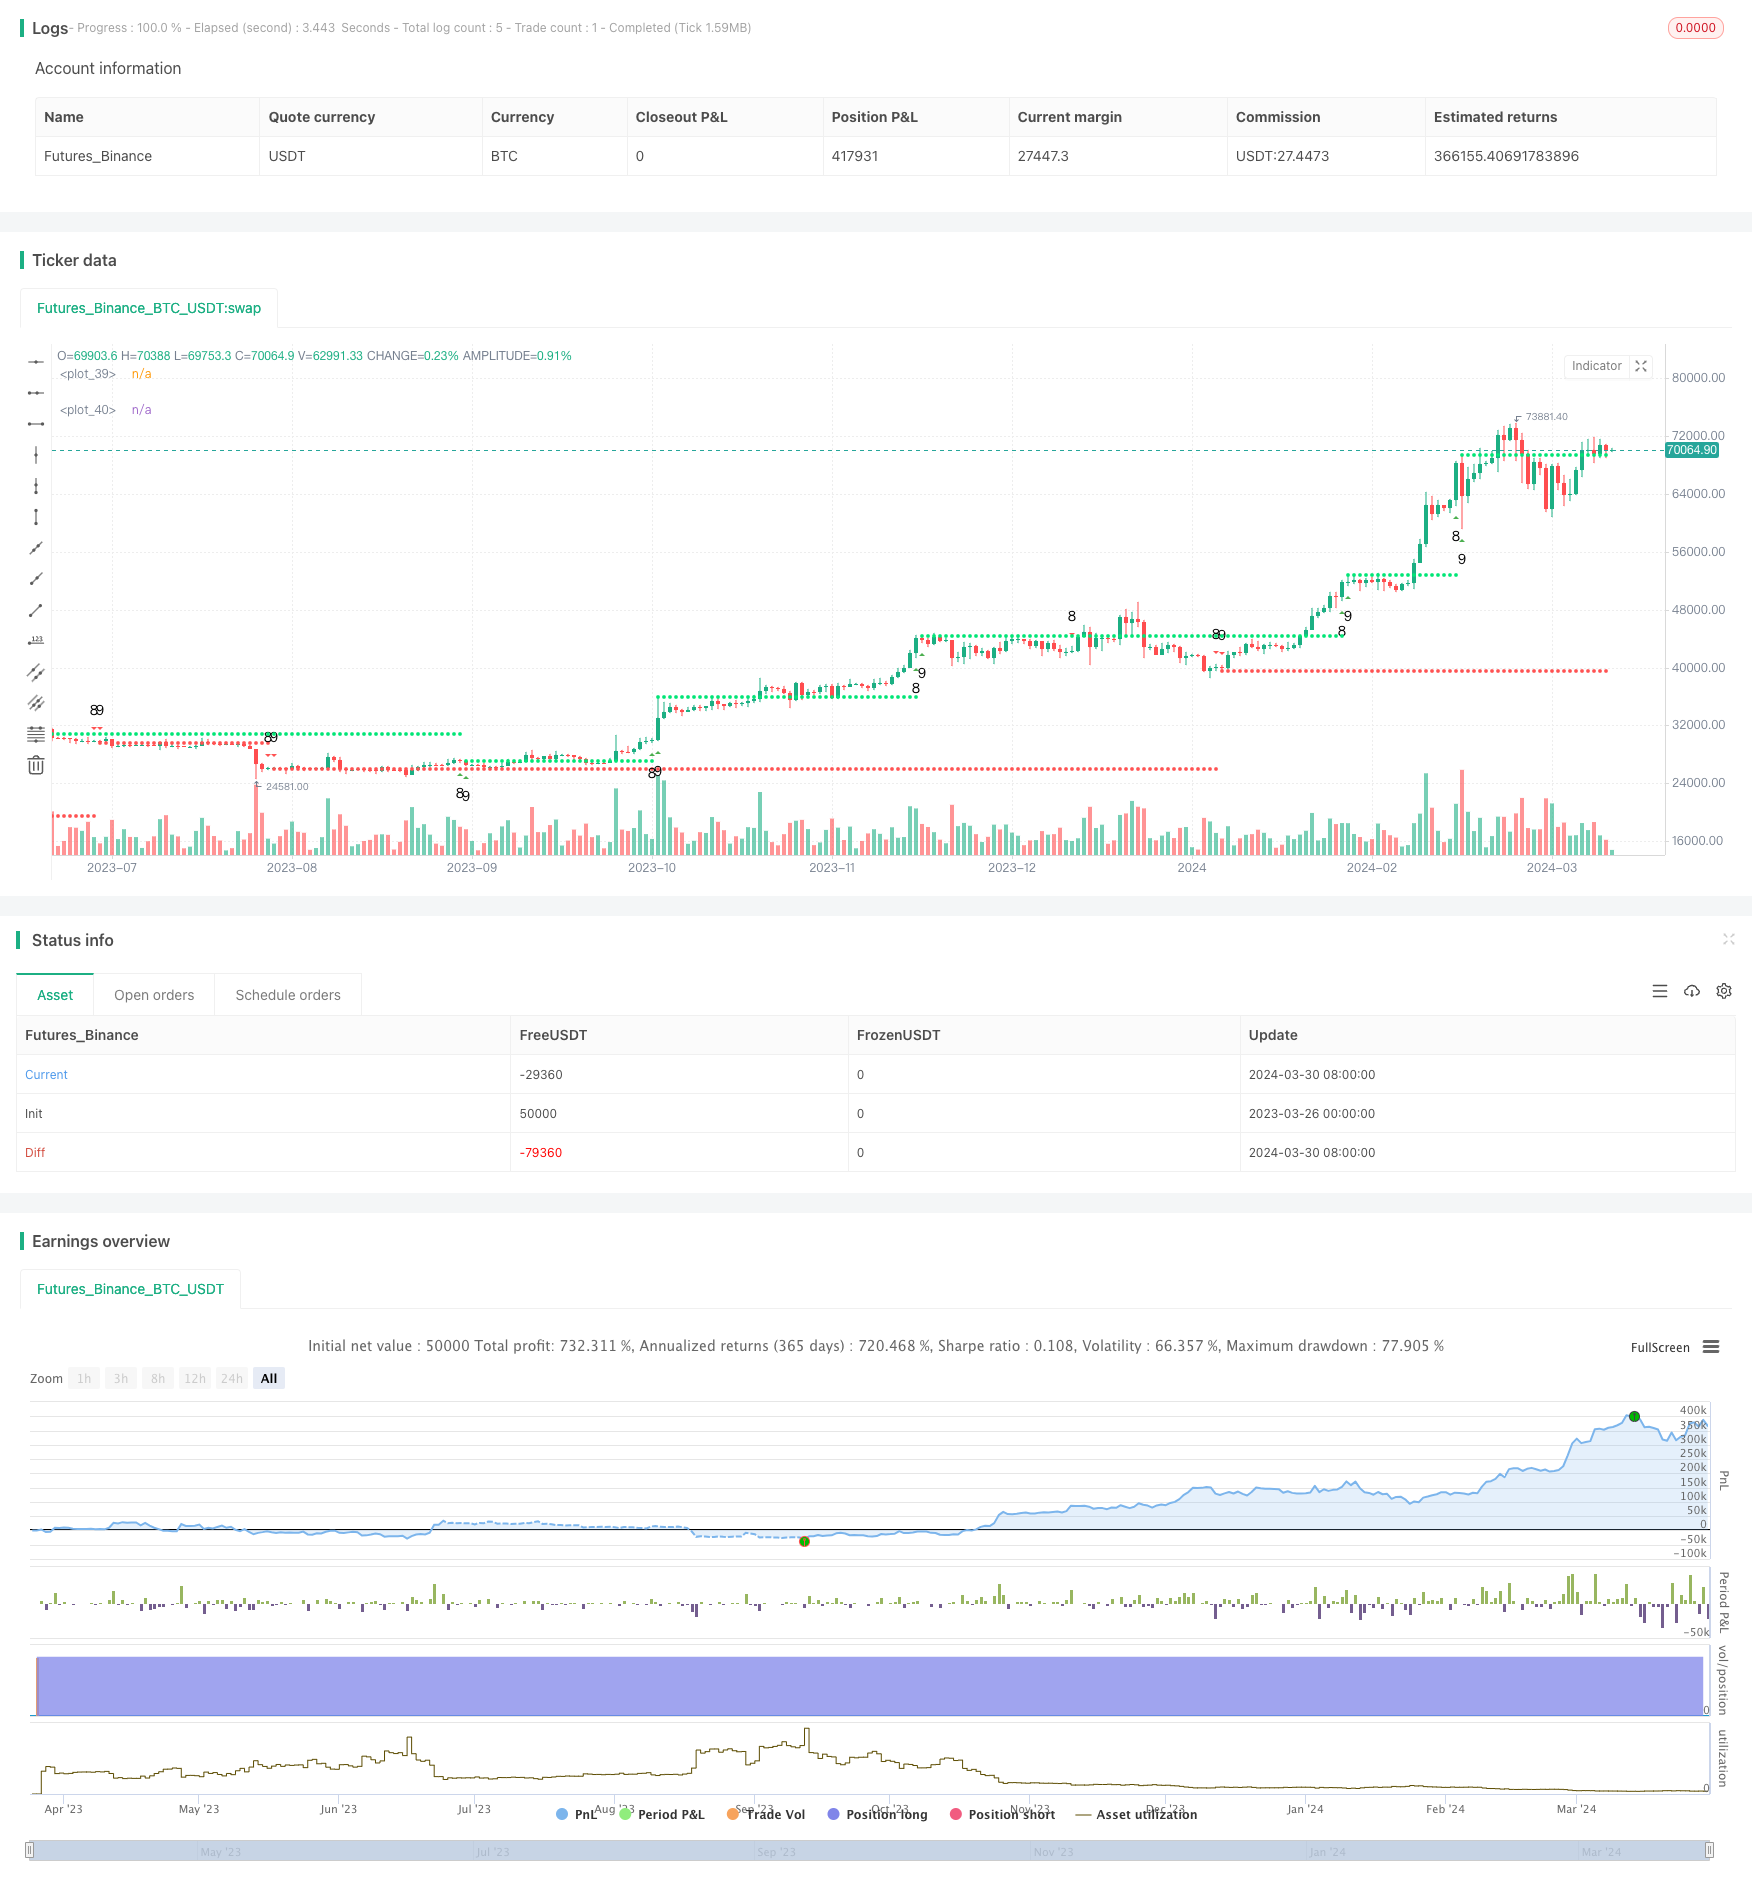
概述
该策略是一个基于TD序列的突破和回撤买卖点策略。它通过识别TD序列中的第8根和第9根K线,来确定潜在的趋势反转点。同时,该策略还考虑了TD序列突破后的回撤情况,以提高入场点的精确度。此外,该策略还利用移动平均线作为趋势判断的辅助工具。
策略原理
- 计算TD序列:通过比较当前收盘价与4根K线前的收盘价,来判断是否出现了连续8根或9根上涨(下跌)的K线。
- 确定买卖点:当出现连续8根或9根上涨(下跌)的K线时,在第8根或第9根K线处标记潜在的卖点(买点)。
- 考虑回撤:在TD序列突破后,观察价格是否出现回撤。如果在第13、14、15或16根K线处仍然保持突破状态,则认为突破有效,否则视为无效突破。
- 趋势判断:利用10日和20日移动平均线的关系,来判断当前的趋势方向,作为买卖决策的参考。
策略优势
- 能够有效识别潜在的趋势反转点,特别是在强势趋势中,TD序列突破后的回撤入场点往往能获得较好的风险收益比。
- 通过考虑TD序列突破后的回撤情况,可以有效过滤掉一些虚假信号,提高入场点的精确度。
- 移动平均线的使用可以帮助判断当前的趋势方向,使得策略在顺势操作时更加有效。
策略风险
- 在震荡市场中,TD序列可能会出现较多的虚假信号,导致频繁交易和资金损失。
- 该策略对于参数的选择较为敏感,不同的市场环境可能需要对参数进行优化和调整。
- 策略缺乏明确的止损机制,可能会在市场出现剧烈波动时承受较大的回撤风险。
策略优化方向
- 引入更多的技术指标,如RSI、MACD等,以提高信号的可靠性和过滤效果。
- 对于TD序列突破后的回撤情况,可以考虑引入更加灵活的判断标准,如利用ATR等指标来动态调整回撤的容忍度。
- 在趋势判断方面,可以尝试使用更多的时间周期组合,如短中长期移动平均线的关系,以获得更全面的趋势判断。
- 引入明确的止损机制,如基于ATR的动态止损,以控制单笔交易的最大亏损。
总结
该策略通过TD序列和移动平均线的结合,能够有效识别潜在的趋势反转点,并通过考虑回撤情况来提高入场点的精确度。尽管策略存在一些风险和局限性,但通过引入更多的技术指标、优化趋势判断方法以及设置明确的止损机制等优化措施,可以进一步提高策略的稳健性和盈利能力。
策略源码
/*backtest
start: 2023-03-26 00:00:00
end: 2024-03-31 00:00:00
period: 1d
basePeriod: 1h
exchanges: [{"eid":"Futures_Binance","currency":"BTC_USDT"}]
*/

//@version=4
strategy("Dipak Shankarrao Chavhan", shorttitle="Dipak Chavhan", overlay=true, pyramiding=0, default_qty_value=10)
Numbers = input(true)
SR = input(true)

var int TD = 0
var int TS = 0
var int TDUp = 0
var int TDDn = 0

TD := close > close[4] ? TD[1] + 1 : 0
TS := close < close[4] ? TS[1] + 1 : 0
TDUp := TD - valuewhen(TD < TD[1], TD, 1)
TDDn := TS - valuewhen(TS < TS[1], TS, 1)

plotshape(Numbers ? (TDUp == 8 ? true : na) : na, style=shape.triangleup, text="8", color=color.new(color.green, 0), location=location.belowbar)
plotshape(Numbers ? (TDUp == 9 ? true : na) : na, style=shape.triangleup, text="9", color=color.new(color.green, 0), location=location.belowbar)
plotshape(Numbers ? (TDDn == 8 ? true : na) : na, style=shape.triangledown, text="8", color=color.new(color.red, 0), location=location.abovebar)
plotshape(Numbers ? (TDDn == 9 ? true : na) : na, style=shape.triangledown, text="9", color=color.new(color.red, 0), location=location.abovebar)

priceflip = barssince(close < close[4])
sellsetup = close > close[4] and priceflip
sell = sellsetup and barssince(priceflip != 9)
sellovershoot = sellsetup and barssince(priceflip != 13)
sellovershoot1 = sellsetup and barssince(priceflip != 14)
sellovershoot2 = sellsetup and barssince(priceflip != 15)
sellovershoot3 = sellsetup and barssince(priceflip != 16)
priceflip1 = barssince(close > close[4])
buysetup = close < close[4] and priceflip1
buy = buysetup and barssince(priceflip1 != 9)
buyovershoot = buysetup and barssince(priceflip1 != 13)
buyovershoot1 = buysetup and barssince(priceflip1 != 14)
buyovershoot2 = buysetup and barssince(priceflip1 != 15)
buyovershoot3 = buysetup and barssince(priceflip1 != 16)
TDbuyh = valuewhen(buy, high, 0)
TDbuyl = valuewhen(buy, low, 0)
TDsellh = valuewhen(sell, high, 0)
TDselll = valuewhen(sell, low, 0)
plot(SR ? (TDbuyh ? TDbuyl : na) : na, style=plot.style_circles, linewidth=2, color=color.red)
plot(SR ? (TDselll ? TDsellh : na) : na, style=plot.style_circles, linewidth=2, color=color.lime)

sma1 = sma(close, 10)
sma2 = sma(close, 20)


if TDbuyh
    strategy.entry("Enter Long", strategy.long)
else if TDselll
    strategy.entry("Enter Short", strategy.short)