RSI50_EMA Long Only Strategy

Overview
The strategy named "RSI50_EMA Long Only Strategy" mainly uses the crossover signals of two technical indicators, Relative Strength Index (RSI) and Exponential Moving Average (EMA), to make trading decisions. It opens a long position when the price breaks above the upper band of EMA from below and RSI is above 50, and closes all long positions when the price breaks below the lower band of EMA from above or RSI falls below 50. This strategy only takes long positions and does not short, it is a trend-following strategy.
Strategy Principle
- Calculate EMA and ATR to get the upper and lower bands of EMA.
- Calculate RSI.
- When the closing price crosses above the upper band of EMA and RSI is above 50, open a long position.
- When the closing price crosses below the lower band of EMA or RSI falls below 50, close all long positions.
- Only long, no short.
Strategy Advantages
- Suitable for use in a strong market, can effectively capture the upward trend of strong stocks.
- Uses both EMA and RSI indicators to better confirm trend signals and improve signal reliability.
- Position management uses percentage stop loss, risk is controllable.
- The code logic is clear and simple, easy to understand and implement.
Strategy Risks
- Prone to frequent trading and large drawdowns in volatile markets.
- Improper parameter selection can lead to signal failure. For example, improper selection of EMA length will lead to lagging trend judgment; improper selection of RSI upper and lower limits will lead to undesirable entry and exit points.
- The strategy can only capture unilateral upward trends, and cannot grasp downward and oscillating trends, easy to miss opportunities.
Strategy Optimization Directions
- Introduce trend confirmation indicators, such as MACD, to improve the accuracy of trend judgment.
- Optimize parameters for RSI, or introduce RSI divergence and other improvements to signals.
- Consider adding trailing stop loss or volatility stop loss to improve risk control.
- Consider adding reversal entry logic in oscillating markets and downward trends.
Summary
The RSI50_EMA Long Only Strategy is a simple and easy-to-use trend-following strategy based on RSI and EMA, suitable for use in unilateral upward trends. The strategy has clear logic and obvious advantages, but also has some shortcomings and risks. By introducing more auxiliary indicators, optimizing parameters, improving risk control and other measures, the stability and profitability of the strategy can be further improved. However, in actual application, it is necessary to flexibly adjust and improve according to market characteristics, personal risk preferences and other factors.
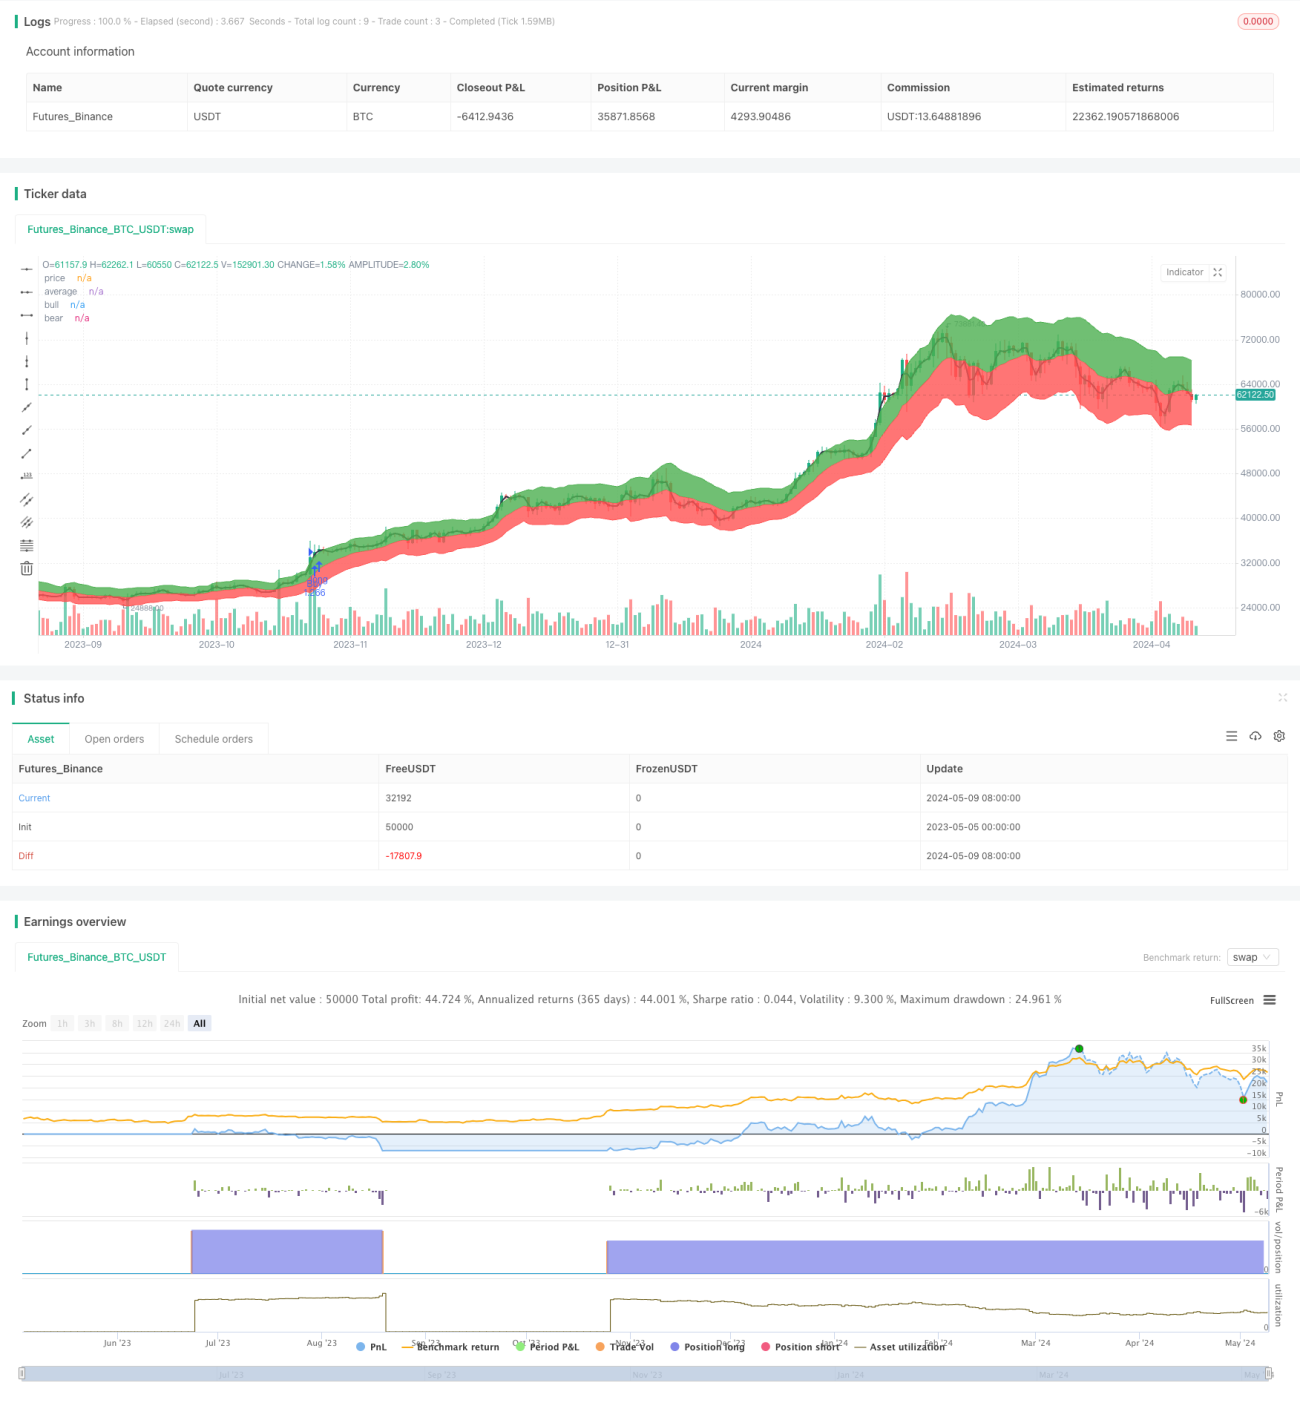
/*backtest
start: 2023-05-05 00:00:00
end: 2024-05-10 00:00:00
period: 1d
basePeriod: 1h
exchanges: [{"eid":"Futures_Binance","currency":"BTC_USDT"}]
*/

//@version=4
strategy("RSI50_EMA Long Only Strategy", overlay=true, default_qty_type=strategy.percent_of_equity, default_qty_value=100)

len = input(11, type=input.integer, minval=1, title="Length")- 1