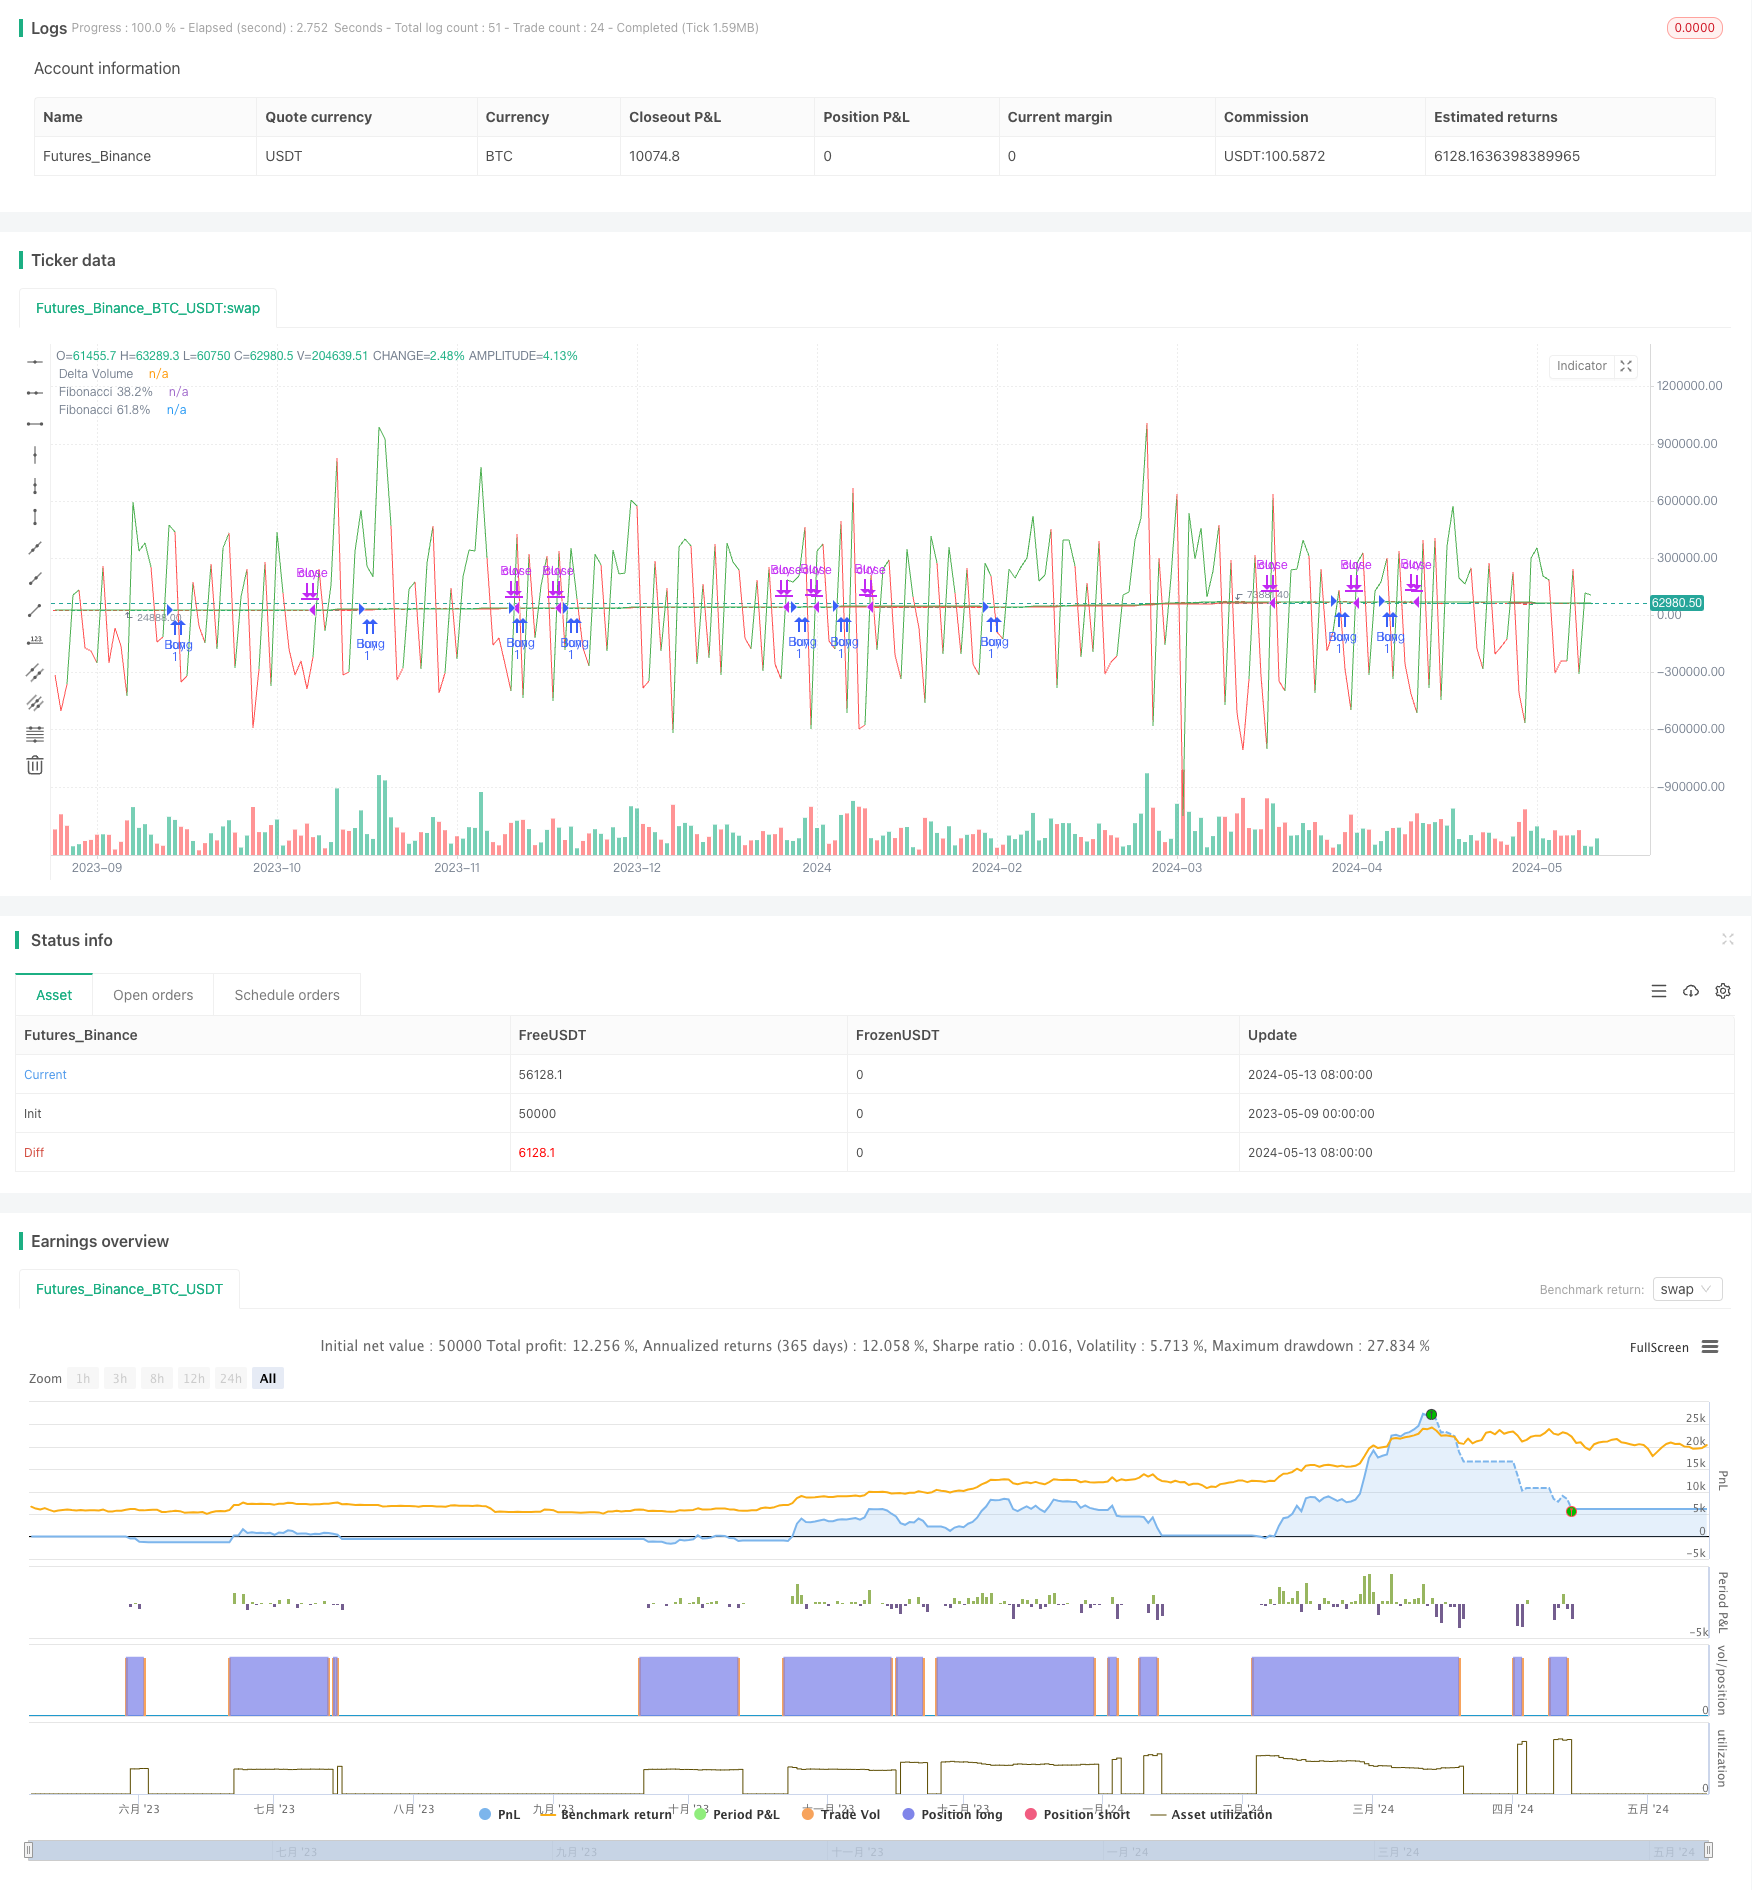
概述
该策略是一种基于成交量增量(Delta Volume)和斐波那契回调(Fibonacci Retracement)的交易策略。它通过比较一段时间内买方和卖方的成交量来判断市场趋势,同时利用斐波那契回调线来确定进出场点。当买方成交量超过卖方成交量,且价格突破61.8%的斐波那契回调线时进场做多;当卖方成交量超过买方成交量,且价格跌破38.2%的斐波那契回调线时平仓。
策略原理
- 计算指定周期内的买方成交量和卖方成交量,并存储在数组中。
- 计算成交量增量(Delta Volume),即买方成交量减去卖方成交量。
- 计算指定周期内的最高价和最低价,并根据它们计算38.2%和61.8%的斐波那契回调线。
- 当成交量增量大于0(买方成交量大于卖方成交量),且收盘价高于61.8%的斐波那契回调线时,开仓做多。
- 当成交量增量小于0(卖方成交量大于买方成交量),且收盘价低于38.2%的斐波那契回调线时,平仓。
策略优势
- 结合成交量和价格两个维度,可以更全面地判断市场趋势。
- 利用斐波那契回调线作为进出场点,有明确的技术支撑。
- 成交量增量指标可以反映市场供需关系,是一个领先指标。
- 参数可调,适用于不同的市场和交易品种。
策略风险
- 在震荡市中,频繁的进出场可能导致较高的交易成本。
- 如果市场出现剧烈波动,价格可能会快速突破斐波那契回调线,导致错过最佳进出场点。
- 该策略依赖于历史数据进行计算,对于新上市的交易品种或数据缺失的情况,可能会影响策略的有效性。
策略优化方向
- 可以考虑引入其他技术指标,如移动平均线、RSI等,以确认趋势和进出场点。
- 对于不同的市场和交易品种,可以优化成交量增量和斐波那契回调的计算周期和参数。
- 在进场后,可以设置移动止损或止盈,以控制风险和锁定利润。
- 可以结合市场情绪指标,如Fear & Greed Index,对策略进行动态调整。
总结
该策略通过结合成交量增量和斐波那契回调线,在趋势形成初期进场,在趋势可能反转时出场,以捕捉市场的主要趋势。但在震荡市中可能会面临频繁交易的风险,因此需要结合其他指标和风控手段进行优化。总体而言,该策略思路清晰,逻辑严谨,可以作为一个基础策略进行进一步的开发和应用。
策略源码
/*backtest
start: 2023-05-09 00:00:00
end: 2024-05-14 00:00:00
period: 1d
basePeriod: 1h
exchanges: [{"eid":"Futures_Binance","currency":"BTC_USDT"}]
*/

//@version=5
strategy("Delta Volume with Fibonacci Levels Strategy", overlay=true)

// Input pour la période de calcul du volume et du delta
N = input(14, title="Période du Delta Volume")
fibLength = input(21, title="Fibonacci Lookback Period")

// Choix de la barre pour l'entrée et la sortie des trades
entryPriceType = input.string("close", title="Entry Price Type", options=["open", "close"])
exitPriceType = input.string("close", title="Exit Price Type", options=["open", "close"])

// Correction des dates de début et de fin pour le backtest
startDate = input(defval = timestamp("2021-01-01"), title = "Start Date")
endDate = input(defval = timestamp("2022-01-01"), title = "End Date")

// Calcul des volumes des acheteurs et des vendeurs
buyerVolume = array.new_float()
sellerVolume = array.new_float()

// Mise à jour des volumes à chaque bougie
buyVol = close > open ? volume : 0
sellVol = close < open ? volume : 0
array.unshift(buyerVolume, buyVol)
array.unshift(sellerVolume, sellVol)

// Gardez seulement les N dernières valeurs pour le delta volume
if array.size(buyerVolume) > N
    array.pop(buyerVolume)
if array.size(sellerVolume) > N
    array.pop(sellerVolume)

// Calcul du delta de volume
sumBuyerVolume = array.sum(buyerVolume)
sumSellerVolume = array.sum(sellerVolume)
deltaVolume = sumBuyerVolume - sumSellerVolume

// Calcul du plus haut et du plus bas pour Fibonacci
highestPrice = ta.highest(high, fibLength)
lowestPrice = ta.lowest(low, fibLength)

// Fibonacci Levels
fib382 = lowestPrice + (highestPrice - lowestPrice) * 0.5
fib618 = lowestPrice + (highestPrice - lowestPrice) * 0.786


// Vérification des dates pour le backtest
bool isInDateRange = true

// Conditions d'entrée et de sortie
entryPrice = entryPriceType == "open" ? open : close
exitPrice = exitPriceType == "open" ? open : close

// Acheter quand le volume des acheteurs dépasse celui des vendeurs, le prix est au-dessus du niveau 61.8% de Fibonacci
if isInDateRange and deltaVolume > 0 and entryPrice > fib618
    strategy.entry("Buy", strategy.long)

// Vendre quand le volume des vendeurs dépasse celui des acheteurs, le prix est en dessous du niveau 38.2% de Fibonacci
if isInDateRange and deltaVolume < 0 and exitPrice < fib382
    strategy.close("Buy")

// Affichage des niveaux de Fibonacci et du delta de volume
plot(fib382, color=color.red, title="Fibonacci 38.2%")
plot(fib618, color=color.green, title="Fibonacci 61.8%")
plot(deltaVolume, color=deltaVolume > 0 ? color.green : color.red, title="Delta Volume")