概述
SR Breakout Strategy是一个基于LonesomeTheBlue的breakout finder指标开发的支撑阻力突破策略。该策略的主要思路是通过判断收盘价是否突破支撑位或阻力位来产生做多或做空信号。默认设置基于8小时K线,但在4小时K线上有更优的参数设置。该策略使用了pivothigh和pivotlow函数来确定支撑位和阻力位,并使用最高价和最低价来判断突破。同时,该策略还设置了止损和止盈。
策略原理
- 使用pivothigh和pivotlow函数分别计算过去一定周期内的高点和低点,并存储到数组中。
- 判断当前收盘价是否高于阻力位,如果是,则判断为看涨突破,产生做多信号。
- 判断当前收盘价是否低于支撑位,如果是,则判断为看跌突破,产生做空信号。
- 在产生交易信号后,根据设置的止损止盈比例计算止损价和止盈价,并设置相应的止损单和止盈单。
- 根据突破方向绘制相应的突破区间。
策略优势
- 支撑阻力突破是一个经典的交易策略,有一定的实战基础。
- 通过使用pivothigh和pivotlow函数计算支撑位和阻力位,可以比较准确地捕捉到突破行情。
- 该策略代码结构清晰,通过存储高点和低点到数组中,可以方便地进行回测和优化。
- 设置了止损和止盈,可以比较好地控制风险。
策略风险
- 支撑阻力突破策略在震荡行情中表现不佳,容易出现频繁的false breakout。
- 固定的止损止盈比例可能无法适应不同的行情,导致风险收益失衡。
- 该策略只考虑了价格因素,而没有考虑成交量等其他重要指标,可能会错过一些重要的信号。
策略优化方向
- 可以考虑引入更多的技术指标,如成交量、MACD等,以提高信号的准确性和可靠性。
- 对于止损和止盈,可以考虑使用移动止损或者动态止损止盈比例,以更好地适应不同的行情。
- 可以考虑引入过滤条件,如趋势过滤、波动率过滤等,以减少在震荡行情中的false breakout。
- 可以考虑对支撑位和阻力位进行优化,如使用自适应周期、引入斐波那契等级等。
总结
SR Breakout Strategy是一个基于经典支撑阻力突破思路的交易策略,通过使用pivothigh和pivotlow函数计算支撑位和阻力位,并通过判断收盘价是否突破这些位置来产生交易信号。该策略的优势在于思路清晰,易于实现和优化;同时也存在一些风险,如在震荡行情中表现不佳,以及固定的止损止盈比例可能带来的风险。未来可以考虑从技术指标、止损止盈、过滤条件、支撑阻力优化等方面对该策略进行优化和改进,以提高其稳定性和盈利能力。
策略源码
/*backtest
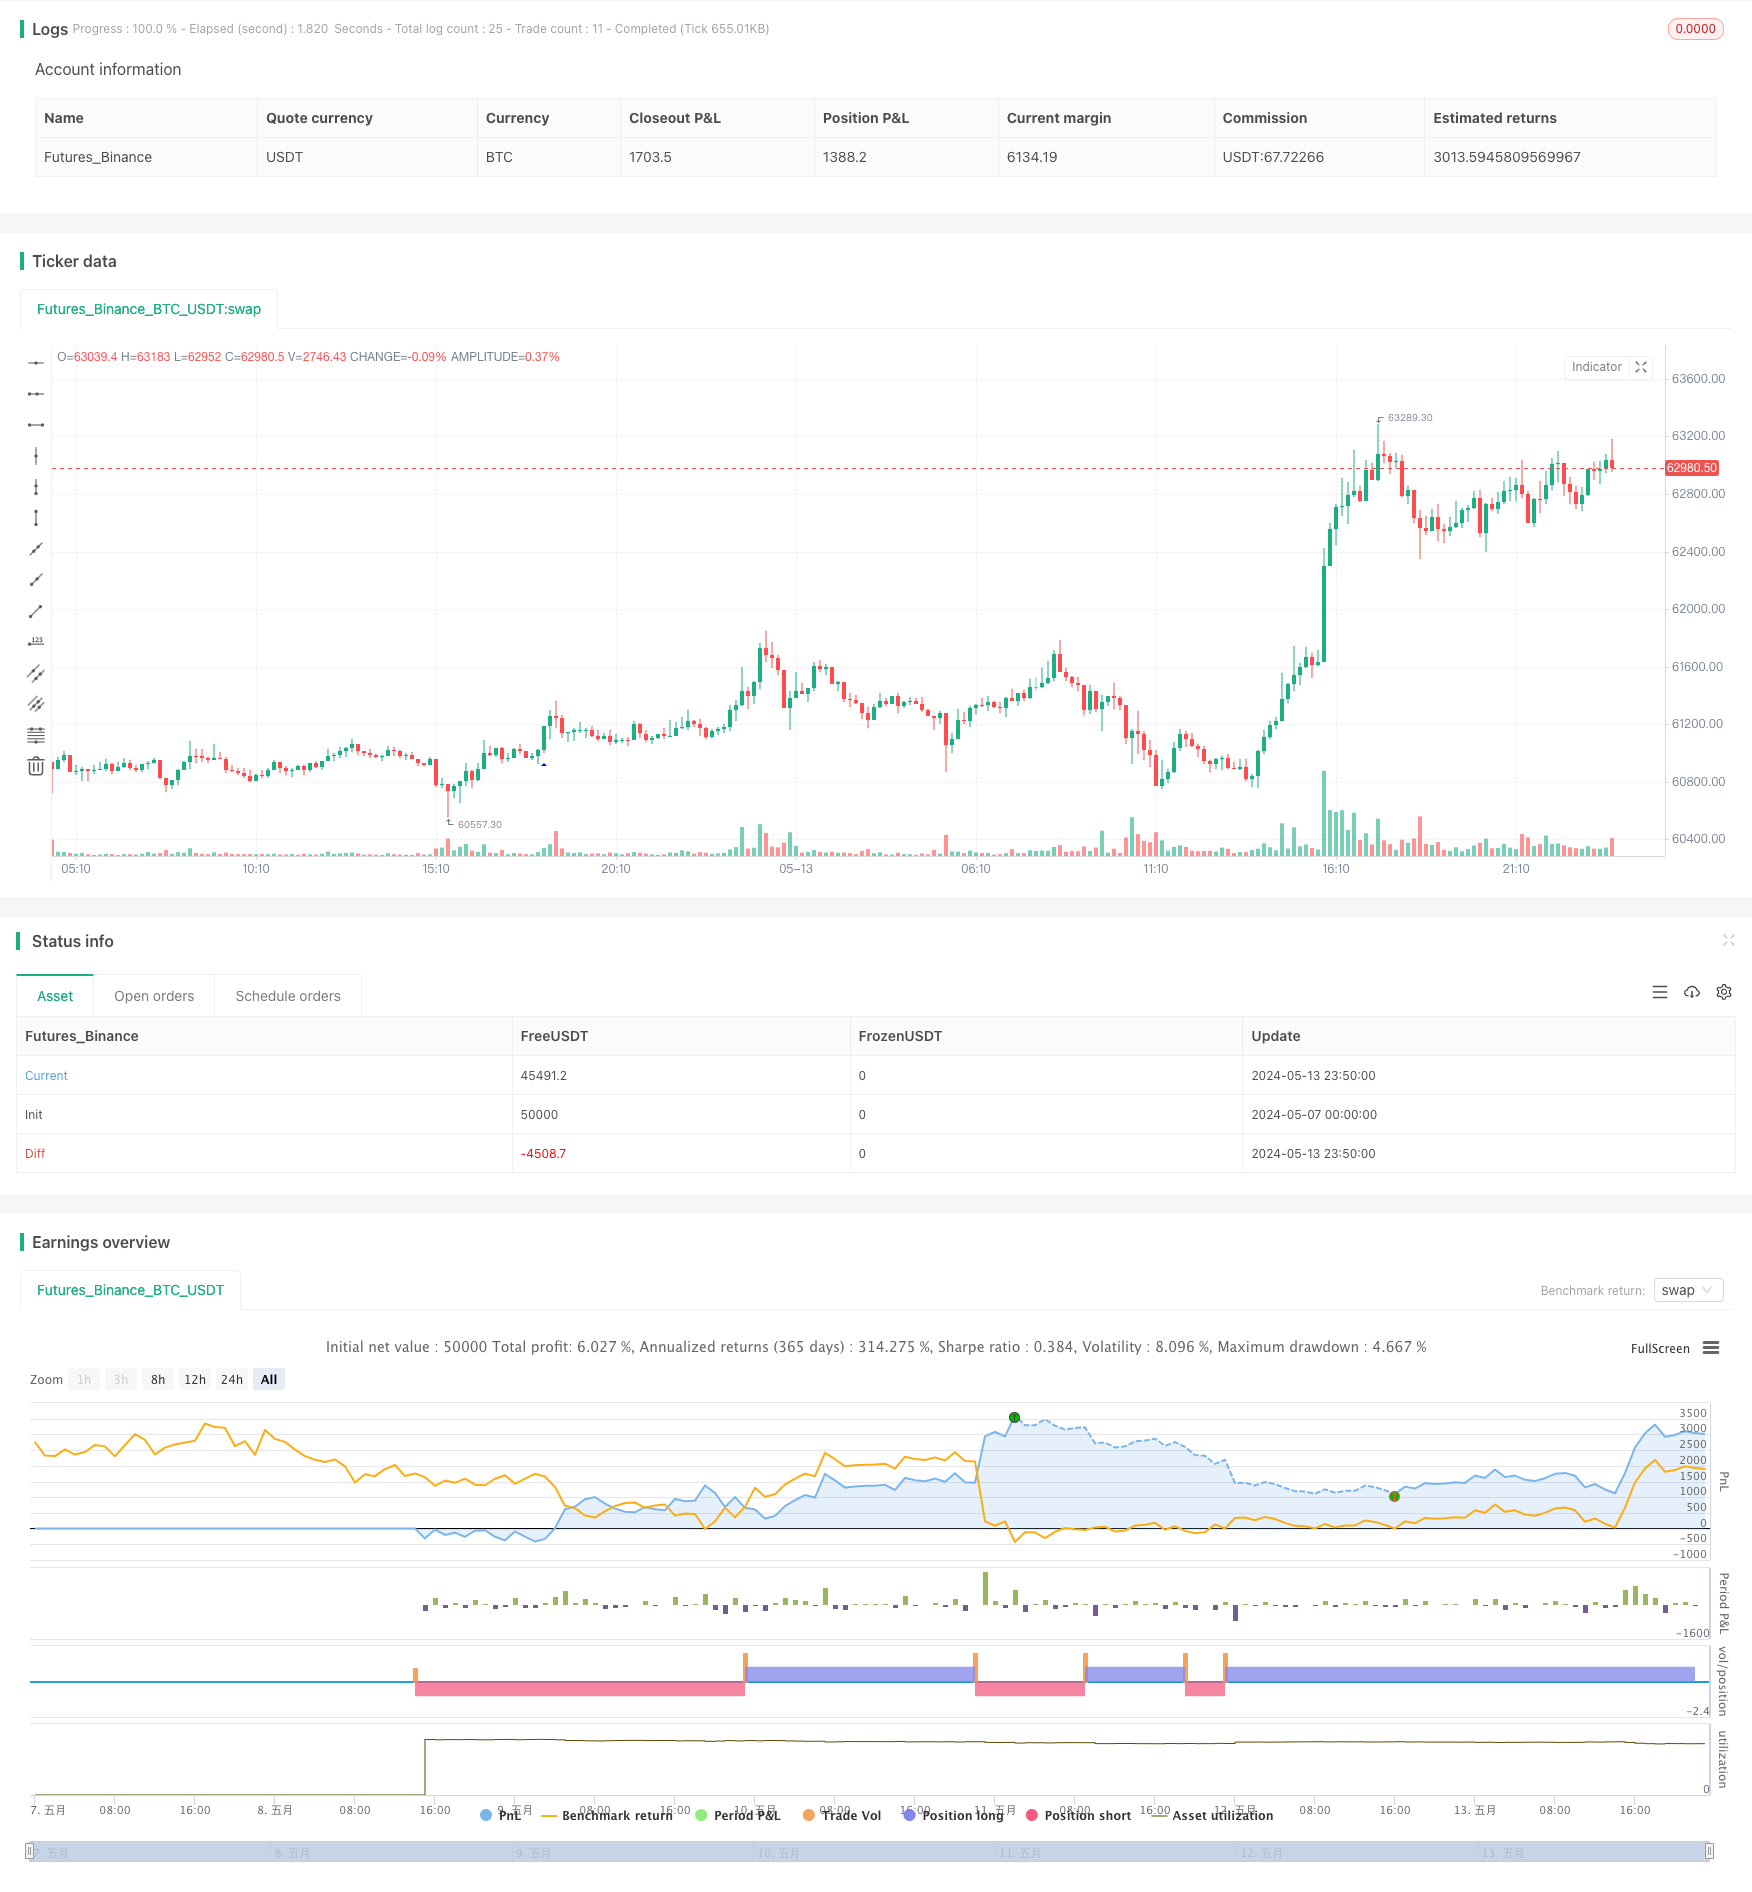
start: 2024-05-07 00:00:00
end: 2024-05-14 00:00:00
period: 10m
basePeriod: 1m
exchanges: [{"eid":"Futures_Binance","currency":"BTC_USDT"}]
*/
// This source code is subject to the terms of the Mozilla Public License 2.0 at https://mozilla.org/MPL/2.0/
// © LonesomeTheBlue © chanu_lev10k
//@version=5
strategy('SR Breakout Strategy', overlay=true, max_bars_back=500, max_lines_count=400)
prd = input.int(defval=5, title='Period', minval=2)
bo_len = input.int(defval=71, title='Max Breakout Length', minval=30, maxval=300)
cwidthu = input.float(defval=3., title='Threshold Rate %', minval=1., maxval=10) / 100
mintest = input.int(defval=2, title='Minimum Number of Tests', minval=1)
bocolorup = input.color(defval=color.blue, title='Breakout Colors', inline='bocol')
bocolordown = input.color(defval=color.red, title='', inline='bocol')
// lstyle = input.string(defval=line.style_solid, title='Line Style')
issl = input.bool(title='SL', inline='linesl1', group='Stop Loss / Take Profit:', defval=false)
slpercent = input.float(title=', %', inline='linesl1', group='Stop Loss / Take Profit:', defval=18.0, minval=0.0, step=0.1)
istp = input.bool(title='TP', inline='linetp1', group='Stop Loss / Take Profit:', defval=false)
tppercent = input.float(title=', %', inline='linetp1', group='Stop Loss / Take Profit:', defval=18.0, minval=0.0, step=0.1)
//width
lll = math.max(math.min(bar_index, 300), 1)
float h_ = ta.highest(lll)
float l_ = ta.lowest(lll)
float chwidth = (h_ - l_) * cwidthu
// check if PH/PL
ph = ta.pivothigh(prd, prd)
pl = ta.pivotlow(prd, prd)
//keep Pivot Points and their locations in the arrays
var phval = array.new_float(0)
var phloc = array.new_int(0)
var plval = array.new_float(0)
var plloc = array.new_int(0)
// keep PH/PL levels and locations
if bool(ph)
array.unshift(phval, ph)
array.unshift(phloc, bar_index - prd)
if array.size(phval) > 1 // cleanup old ones
for x = array.size(phloc) - 1 to 1 by 1
if bar_index - array.get(phloc, x) > bo_len
array.pop(phloc)
array.pop(phval)
if bool(pl)
array.unshift(plval, pl)
array.unshift(plloc, bar_index - prd)
if array.size(plval) > 1 // cleanup old ones
for x = array.size(plloc) - 1 to 1 by 1
if bar_index - array.get(plloc, x) > bo_len
array.pop(plloc)
array.pop(plval)
// check bullish cup
float bomax = na
int bostart = bar_index
num = 0
hgst = ta.highest(prd)[1]
if array.size(phval) >= mintest and close > open and close > hgst
bomax := array.get(phval, 0)
xx = 0
for x = 0 to array.size(phval) - 1 by 1
if array.get(phval, x) >= close
break
xx := x
bomax := math.max(bomax, array.get(phval, x))
bomax
if xx >= mintest and open <= bomax
for x = 0 to xx by 1
if array.get(phval, x) <= bomax and array.get(phval, x) >= bomax - chwidth
num += 1
bostart := array.get(phloc, x)
bostart
if num < mintest or hgst >= bomax
bomax := na
bomax
// if not na(bomax) and num >= mintest
// line.new(x1=bar_index, y1=bomax, x2=bostart, y2=bomax, color=bocolorup)
// line.new(x1=bar_index, y1=bomax - chwidth, x2=bostart, y2=bomax - chwidth, color=bocolorup)
// line.new(x1=bostart, y1=bomax - chwidth, x2=bostart, y2=bomax, color=bocolorup)
// line.new(x1=bar_index, y1=bomax - chwidth, x2=bar_index, y2=bomax, color=bocolorup)
plotshape(not na(bomax) and num >= mintest, location=location.belowbar, style=shape.triangleup, color=bocolorup, size=size.small)
//alertcondition(not na(bomax) and num >= mintest, title='Breakout', message='Breakout')
// check bearish cup
float bomin = na
bostart := bar_index
num1 = 0
lwst = ta.lowest(prd)[1]
if array.size(plval) >= mintest and close < open and close < lwst
bomin := array.get(plval, 0)
xx = 0
for x = 0 to array.size(plval) - 1 by 1
if array.get(plval, x) <= close
break
xx := x
bomin := math.min(bomin, array.get(plval, x))
bomin
if xx >= mintest and open >= bomin
for x = 0 to xx by 1
if array.get(plval, x) >= bomin and array.get(plval, x) <= bomin + chwidth
num1 += 1
bostart := array.get(plloc, x)
bostart
if num1 < mintest or lwst <= bomin
bomin := na
bomin
// if not na(bomin) and num1 >= mintest
// line.new(x1=bar_index, y1=bomin, x2=bostart, y2=bomin, color=bocolordown)
// line.new(x1=bar_index, y1=bomin + chwidth, x2=bostart, y2=bomin + chwidth, color=bocolordown)
// line.new(x1=bostart, y1=bomin + chwidth, x2=bostart, y2=bomin, color=bocolordown)
// line.new(x1=bar_index, y1=bomin + chwidth, x2=bar_index, y2=bomin, color=bocolordown)
plotshape(not na(bomin) and num1 >= mintest, location=location.abovebar, style=shape.triangledown, color=bocolordown, size=size.small)
//alertcondition(not na(bomin) and num1 >= mintest, title='Breakdown', message='Breakdown')
//alertcondition(not na(bomax) and num >= mintest or not na(bomin) and num1 >= mintest, title='Breakout or Breakdown', message='Breakout or Breakdown')
// Long Short conditions
longCondition = not na(bomax) and num >= mintest
if longCondition
strategy.entry('Long', strategy.long)
shortCondition = not na(bomin) and num1 >= mintest
if shortCondition
strategy.entry('Short', strategy.short)
// Entry price / Take Profit / Stop Loss
//entryprice = strategy.position_avg_price
entryprice = ta.valuewhen(condition=longCondition or shortCondition, source=close, occurrence=0)
pm = longCondition ? 1 : shortCondition ? -1 : 1 / math.sign(strategy.position_size)
takeprofit = entryprice * (1 + pm * tppercent * 0.01)
stoploss = entryprice * (1 - pm * slpercent * 0.01)
strategy.exit(id='Exit Long', from_entry='Long', stop=issl ? stoploss : na, limit=istp ? takeprofit : na, alert_message='Exit Long')
strategy.exit(id='Exit Short', from_entry='Short', stop=issl ? stoploss : na, limit=istp ? takeprofit : na, alert_message='Exit Short')