Quantitative Trading Strategy Based on Reversal Patterns at Support and Resistance Levels

Overview
This strategy is based on reversal patterns (hammer, engulfing, and doji) and support and resistance levels in technical analysis, trading on a 1-hour chart. The strategy identifies potential market reversal points and executes trades with predefined take profit and stop loss levels.
The main idea of the strategy is to enter a long position when a bullish reversal pattern (such as a hammer, bullish engulfing, or doji) appears near a support level, and to enter a short position when a bearish reversal pattern (such as a hammer, bearish engulfing, or doji) appears near a resistance level. Take profit and stop loss levels are set to control risk and lock in profits.
Strategy Logic
- Calculate the lowest low and highest high within the specified lookback period using ta.lowest() and ta.highest() functions to determine support and resistance levels.
- Check if the current candlestick forms a hammer, engulfing pattern, or doji.
- If a bullish reversal pattern appears near a support level, enter a long position; if a bearish reversal pattern appears near a resistance level, enter a short position.
- Set the take profit price at 3% above the entry price and the stop loss price at 1% below the entry price.
- Close the position when the price reaches the take profit or stop loss level.
Strategy Advantages
- Combines reversal patterns and key support and resistance levels, improving the reliability of trading signals.
- Sets clear take profit and stop loss levels, effectively controlling risk.
- Suitable for both trending and ranging markets, capturing potential reversal opportunities.
- Simple and easy-to-understand code, facilitating implementation.
Strategy Risks
- In ranging markets, frequent reversal signals may lead to overtrading and commission losses.
- The identification of support and resistance levels depends on the choice of lookback period, and different lookback periods may lead to different results.
- The reliability of reversal patterns is not absolute, and false signals may result in losses.
Solutions:
- Adjust the parameters and confirmation conditions of reversal patterns to reduce false signals.
- Incorporate other technical indicators or market sentiment indicators to improve signal reliability.
- Adjust take profit and stop loss levels appropriately to adapt to different market conditions.
Strategy Optimization Directions
- Introduce volume indicators to confirm the validity of reversal patterns. Reversal patterns with high trading volume may be more reliable.
- Consider support and resistance levels from multiple time frames to improve the accuracy of support and resistance levels.
- Combine trend indicators, such as moving averages, to trade in the direction of the trend and avoid counter-trend trading.
- Optimize take profit and stop loss levels by dynamically adjusting them based on market volatility to achieve better risk-reward ratios.
Summary
This strategy captures potential trading opportunities by identifying reversal patterns near support and resistance levels. It is simple to use and applicable to different market environments. However, the success of the strategy depends on the accurate identification of reversal patterns and support and resistance levels. By optimizing the confirmation conditions of trading signals, incorporating other technical indicators, and dynamically adjusting take profit and stop loss levels, the performance of the strategy can be further improved.
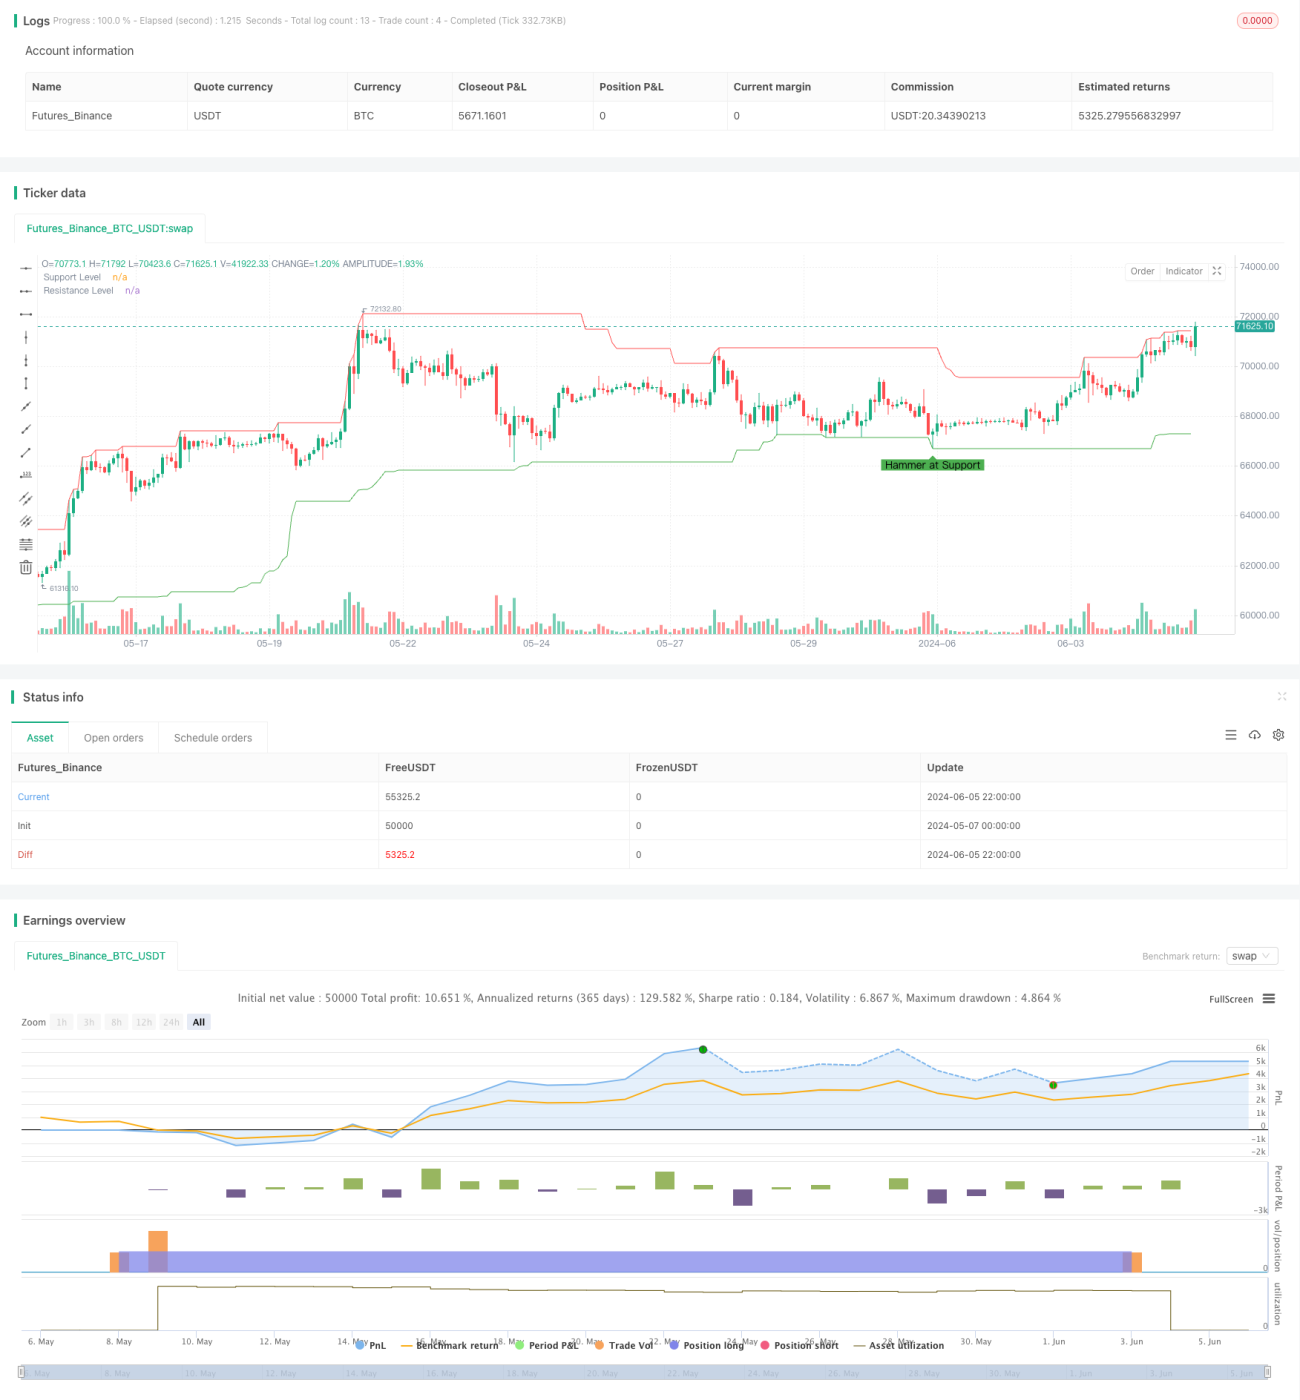
/*backtest
start: 2024-05-07 00:00:00
end: 2024-06-06 00:00:00
period: 2h
basePeriod: 15m
exchanges: [{"eid":"Futures_Binance","currency":"BTC_USDT"}]
*/

// This Pine Script™ code is subject to the terms of the Mozilla Public License 2.0 at https://mozilla.org/MPL/2.0/
// © Kingcoinmilioner

//@version=5- 1