Multi-Timeframe Bitcoin Trading Strategy Based on EMA and RSI Dynamic Momentum Strength

Overview
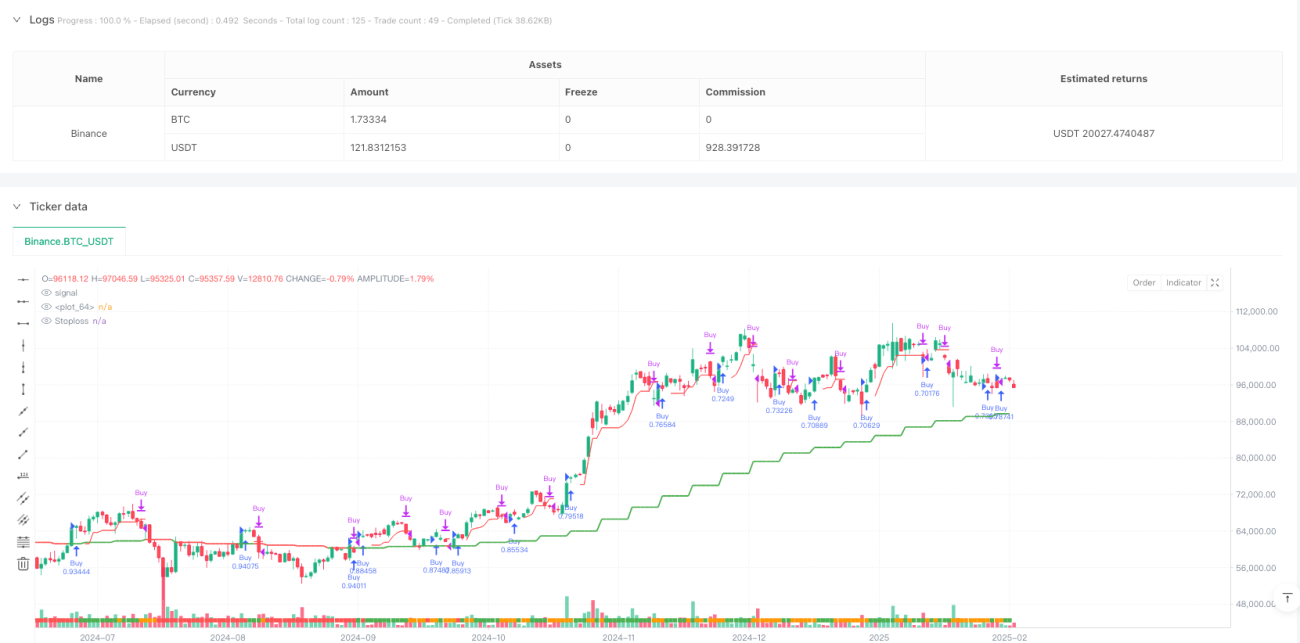
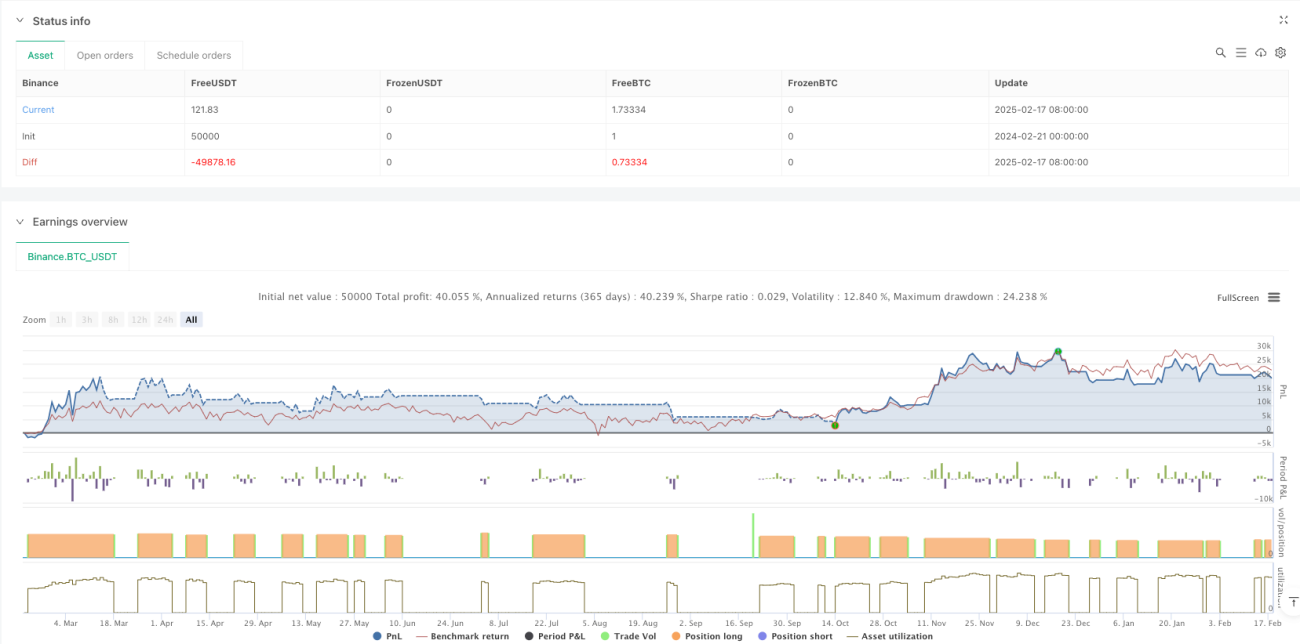
This strategy is a trend-following trading system based on cross-timeframe analysis, combining weekly and daily EMA levels with RSI indicators to identify market trends and momentum. The strategy determines trading opportunities through trend confluence across multiple timeframes and uses ATR-based dynamic stop-loss for risk management. The system employs a capital management approach, using 100% of account funds per trade, with a 0.1% trading commission consideration.
Strategy Principles
The core logic of the strategy is based on the following key elements:
- Uses weekly EMA as the primary trend filter, combined with the relationship between daily closing price and weekly EMA to determine market conditions
- Dynamically adjusts trend determination thresholds through ATR indicator, increasing strategy adaptability
- Integrates RSI momentum indicator as additional trading filter
- Employs a trailing stop-loss system based on 7-day low and ATR
- Strategy pauses new positions when excessive uptrend warning signals appear to avoid risks
Strategy Advantages
- Multi-timeframe analysis provides a more comprehensive market perspective, effectively filtering false breakouts
- Dynamic stop-loss mechanism adapts to market volatility, providing flexible risk control
- RSI momentum filter helps confirm trend strength, improving entry quality
- System includes excessive uptrend warning mechanism, helping avoid drawdown risks
- Strategy parameters are highly adjustable, facilitating optimization for different market environments
Strategy Risks
- May result in frequent entries and exits in ranging markets, increasing trading costs
- Using 100% funds per trade carries significant drawdown risk
- Reliance on technical indicators may lead to delayed responses to market events
- Multi-timeframe analysis may produce conflicting signals at different levels
- Trailing stop-loss may be triggered prematurely during severe volatility
Strategy Optimization Directions
- Introduce volatility filter to reduce trading frequency during low volatility periods
- Add position management system to dynamically adjust holding ratios based on market conditions
- Integrate fundamental indicators for additional market environment assessment
- Optimize trailing stop-loss parameters for better adaptation to different market phases
- Include volume analysis to improve trend determination accuracy
Summary
This is a well-structured trend-following strategy with clear logic. Through multi-timeframe analysis and dynamic indicator filtering, the strategy can effectively capture major trends. While inherent risks exist, there is significant room for improvement through parameter optimization and supplementary indicators. It is recommended to conduct thorough backtesting before live trading and adjust parameters according to specific market conditions.
/*backtest
start: 2024-02-21 00:00:00
end: 2025-02-18 08:00:00
period: 1d
basePeriod: 1d
exchanges: [{"eid":"Binance","currency":"BTC_USDT"}]
*/

// @version=6
strategy("Bitcoin Regime Filter Strategy",         // Strategy name
     overlay=true,                                 // The strategy will be drawn directly on the price chart
initial_capital=10000, // Initial capital of 10000 USD- 1