
In the last article on the Event-Driven Backtester series we considered a basic ExecutionHandler hierarchy. In this article we are going to discuss how to assess the performance of a strategy post-backtest using the previously constructed equity curve DataFrame in the Portfolio object.
Performance Metrics
We've already considered the Sharpe Ratio in a previous article. In that article I outline that the (annualised) Sharpe ratio is calculated via:
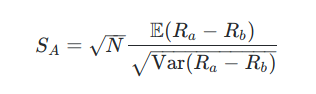
Where Ra is the returns stream of the equity curve and Rb is a benchmark, such as an appropriate interest rate or equity index.
The maximum drawdown and drawdown duration are two additional measures that investors often uses to assess the risk in a portfolio. The former quantities the highest peak-to-trough decline in an equity curve performance, while the latter is defined as the number of trading periods over which it occurs.
In this article we will implement the Sharpe ratio, maximum drawdown and drawdown duration as measures of portfolio performance for use in the Python-based Event-Driven Backtesting suite.
Python Implementation
The first task is to create a new file performance.py, which stores the functions to calculate the Sharpe ratio and drawdown information. As with most of our calculation-heavy classes we need to import NumPy and pandas:
# performance.py
import numpy as np
import pandas as pd
Note that the Sharpe ratio is a measure of risk to reward (in fact it is one of many!). It has a single parameter, that of the number of periods to adjust for when scaling up to the annualised value.
Usually this value is set to 252, which is the number of trading days in the US per year. However, if your strategy trades within the hour you need to adjust the Sharpe to correctly annualise it. Thus you need to set periods to 252∗6.5=1638, which is the number of US trading hours within a year. If you trade on a minutely basis, then this factor must be set to 252∗6.5∗60=98280.
The create_sharpe_ratio function operates on a pandas Series object called returns and simply calculates the ratio of the mean of the period percentage returns and the period percentage return standard deviations scaled by the periods factor:
            # performance.py

def create_sharpe_ratio(returns, periods=252):
    """
    Create the Sharpe ratio for the strategy, based on a
    benchmark of zero (i.e. no risk-free rate information).

    Parameters:
    returns - A pandas Series representing period percentage returns.
    periods - Daily (252), Hourly (252*6.5), Minutely(252*6.5*60) etc.
    """
    return np.sqrt(periods) * (np.mean(returns)) / np.std(returns)
While the Sharpe ratio characterises how much risk (as defined by asset path standard deviation) is being taken per unit of return, the "drawdown" is defined as the largest peak-to-trough drop along an equity curve.
The create_drawdowns function below actually provides both the maximum drawdown and the maximum drawdown duration. The former is the aforementioned largest peak-to-trough drop, while the latter is defined as the number of periods over which this drop occurs.
There is some subtlety required in the interpretation of the drawdown duration as it counts trading periods and thus is not directly translateable into a temporal unit such as "days".
The function starts by creating two pandas Series objects representing the drawdown and duration at each trading "bar". Then the current high water mark (HWM) is established by determining if the equity curve exceeds all previous peaks.
The drawdown is then simply the difference between the current HWM and the equity curve. If this value is negative then the duration is increased for every bar that this occurs until the next HWM is reached. The function then simply returns the maximum of each of the two Series:
            # performance.py

def create_drawdowns(equity_curve):
    """
    Calculate the largest peak-to-trough drawdown of the PnL curve
    as well as the duration of the drawdown. Requires that the
    pnl_returns is a pandas Series.

    Parameters:
    pnl - A pandas Series representing period percentage returns.

    Returns:
    drawdown, duration - Highest peak-to-trough drawdown and duration.
    """

    # Calculate the cumulative returns curve
    # and set up the High Water Mark
    # Then create the drawdown and duration series
    hwm = [0]
    eq_idx = equity_curve.index
    drawdown = pd.Series(index = eq_idx)
    duration = pd.Series(index = eq_idx)

    # Loop over the index range
    for t in range(1, len(eq_idx)):
        cur_hwm = max(hwm[t-1], equity_curve[t])
        hwm.append(cur_hwm)
        drawdown[t]= hwm[t] - equity_curve[t]
        duration[t]= 0 if drawdown[t] == 0 else duration[t-1] + 1
    return drawdown.max(), duration.max()
In order to make use of these performance measures we need a means of calculating them after a backtest has been carried out, i.e. when a suitable equity curve is available!
We also need to associate the calculation with a particular object hierarchy. Given that the performance measures are calculated on a portfolio basis, it makes sense to attach the performance calculations to a method on the Portfolio class hierarchy that we discussed in this article.
The first task is to open up portfolio.py as discussed in the previous article and import the performance functions:
            # portfolio.py

..  # Other imports

from performance import create_sharpe_ratio, create_drawdowns
Since Portfolio is an abstract base class we want to attach a method to one of its derived classes, which in this case will be NaivePortfolio. Hence we will create a method called output_summary_stats that will act on the portfolio equity curve to generate the Sharpe and drawdown information.
The method is straightforward. It simply utilises the two performance measures and applies them directly to the equity curve pandas DataFrame, outputting the statistics as a list of tuples in a format-friendly manner:
            # portfolio.py

..
..

class NaivePortfolio(object):

    ..
    ..

    def output_summary_stats(self):
        """
        Creates a list of summary statistics for the portfolio such
        as Sharpe Ratio and drawdown information.
        """
        total_return = self.equity_curve['equity_curve'][-1]
        returns = self.equity_curve['returns']
        pnl = self.equity_curve['equity_curve']

        sharpe_ratio = create_sharpe_ratio(returns)
        max_dd, dd_duration = create_drawdowns(pnl)

        stats = [("Total Return", "%0.2f%%" % ((total_return - 1.0) * 100.0)),
                 ("Sharpe Ratio", "%0.2f" % sharpe_ratio),
                 ("Max Drawdown", "%0.2f%%" % (max_dd * 100.0)),
                 ("Drawdown Duration", "%d" % dd_duration)]
        return stats
Clearly this is a very simple performance analysis for a portfolio. It does not consider trade-level analysis or other measures of risk/reward. However it is straightforward to extend by adding more methods into performance.py and then incorporating them into output_summary_stats as required.
- 1