PINE Language Introductory Tutorial of FMZ Quant
 0
3515
0
3515
.3, limit=3)
if not barstate.ishistory and close < open strategy.cancel(“long1”) strategy.cancel(“long2”) strategy.cancel(“long3”) isStop := true
---------------------------

6. ```strategy.cancel_all```

The ```strategy.cancel_all``` function is similar to the ```strategy.cancel``` function. It can cancel/stop all pre-listed commands. The ```when``` parameter can be specified.

Parameters:

- ```when```: Execution conditions.

```pine
/*backtest
start: 2022-07-03 00:00:00
end: 2022-07-09 00:00:00
period: 1d
basePeriod: 1h
exchanges: [{"eid":"Binance","currency":"BTC_USDT"}]
*/

strategy("strategy.cancel Demo", pyramiding=3)

var isStop = false
if isStop
    runtime.error("stop")

strategy.entry("long1", strategy.long, 0.1, limit=1)
strategy.entry("long2", strategy.long, 0.2, limit=2)
strategy.entry("long3", strategy.long, 0.3, limit=3)

if not barstate.ishistory and close < open
    strategy.cancel_all()
    isStop := true
strategy.order
The functionality and parameter settings of strategy.order function are almost identical to those of strategy.entry. The difference is that the strategy.order function is not affected by the pyramiding parameter settings of the strategy function, and there is no order count limit.
Parameters:
- id: It can be understood as giving a name to a trading position for referencing. The id can be referenced to cancel, modify orders and close positions.
- direction: If the direction of the order is long (buy), pass in the built-in variable strategy.long, and if you want to go short (sell), pass in the variable strategy.short.
- qty: Specify the amount of orders to be placed, if this parameter is not passed, the default amount of orders will be used.
- when: Execution condition, you can specify this parameter to control whether this current order operation is triggered or not.
- limit: Specify the order limit price.
- stop: Stop loss price.
We’ll use the feature that strategy.order has no limit on the number of orders placed, combined with the strategy.exit conditional exit function to construct a script similar to grid trading. The example is very simple and for learning purposes only:
/*backtest
start: 2021-03-01 00:00:00
end: 2022-08-30 00:00:00
period: 1d
basePeriod: 1h
exchanges: [{"eid":"Binance","currency":"ETH_USDT"}]
args: [["ZPrecision",0,358374]]
*/

varip beginPrice = -1

if not barstate.ishistory
    if beginPrice == -1 or (math.abs(close - beginPrice) > 1000 and strategy.opentrades == 0)
        beginPrice := close

    for i = 0 to 20
        strategy.order("buy"+i, strategy.long, 0.01, limit=beginPrice-i*200, when=(beginPrice-i*200)<close)
        strategy.exit("coverBuy"+i, "buy"+i, qty=0.01, profit=200)

        strategy.order("sell"+i, strategy.short, 0.01, limit=beginPrice+i*200, when=(beginPrice+i*200)>close)
        strategy.exit("coverSell"+i, "sell"+i, qty=0.01, profit=200)
Strategy Examples
The strategy examples in this tutorial are for instructional purposes only, to guide strategy design ideas, and not for any trading guidance or advice. Please do not use the teaching strategies for actual trading.
Super Trend Indicator Strategy
strategy("supertrend", overlay=true)

[supertrend, direction] = ta.supertrend(input(5, "factor"), input.int(10, "atrPeriod"))

plot(direction < 0 ? supertrend : na, "Up direction", color = color.green, style=plot.style_linebr)
plot(direction > 0 ? supertrend : na, "Down direction", color = color.red, style=plot.style_linebr)

if direction < 0
    if supertrend > supertrend[2]
        strategy.entry("entry long", strategy.long)
    else if strategy.position_size < 0
        strategy.close_all()
else if direction > 0
    if supertrend < supertrend[3]
        strategy.entry("entry short", strategy.short)
    else if strategy.position_size > 0
        strategy.close_all()
It is very easy to write a trending strategy by using the Pine language, and here we will design a simple trend following strategy with a super trend indicator. Let’s analyze this strategy source code together.
First, the strategy code starts with some simple settings by using the strategy function: strategy("supertrend", overlay=true)``, which just sets a strategy title "supertrend". Theoverlayparameter is set totrue, so that the drawn indicator lines and other content are displayed on the main chart. The first thing we need to look at when designing a Pine strategy or learning a Pine strategy script is the strategy interface parameter design. Let's look at the source code of the ''supertrend indicator strategy'', which has theinput”` function we learned in the previous course
[supertrend, direction] = ta.supertrend(input(5, “factor”), input.int(10, “atrPeriod”))
The input function call is used as a parameter directly to the ta.supertrend indicator function to calculate the supertrend indicator. Among them:
- input(5, “factor”)
- input.int(10, “atrPeriod”)
By default, the function sets out two parameter controls on the Pine language strategy screen, as shown below:
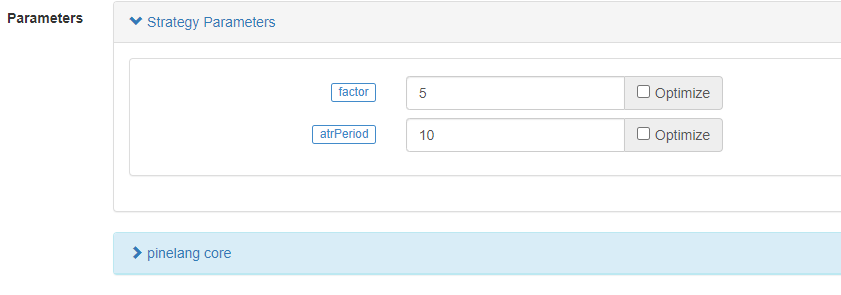
As we can see, the default value on the control is the first parameter of the input function and the input series of functions (here is input.int), which were also explained in the previous sections. With these two functions, we can then set the parameters of the ta.supertrend function on the strategy screen. The supertrend function calculates a price data supertrend and a direction data direction. Then we use the plot function to draw a chart, note that when drawing the chart, it is based on the direction of the supertrend indicator, only the current direction is drawn. When direction is -1, the current market trend is upward, when direction is 1, the current market trend is downward. So we can see that the plot function draws the chart when the judgment direction is greater than or less than 0.
The next if... else if logic is the judgment of the trading signal. When the expression direction < 0 is true, it means that the current market is in the upward stage. At this time, if the price data supertrend in the super trend indicator is higher than the price of the super trend indicator on the two previous BARs (that is, supertrend[2], remember that the historical operator refers to the historical data of a variable), it will be used as an entry signal to go long. Remember that? If there is a current position, calling the reverse order function will close the previous position first, and then open the position according to the current trading direction. In addition, even if the condition supertrend > supertrend[2] have not been met, as long as the strategy.position_size < 0 holding short positions, it will trigger strategy.close_all() function execution to close all positions.
**For ```ta.supertrend``` indicator, are someone interested in how to judge whether the current trend is upward or downward?**

In fact, this indicator can also be implemented in the form of custom functions in the Pine language:

```pine
pine_supertrend(factor, atrPeriod) =>
	src = hl2
	atr = ta.atr(atrPeriod)
	upperBand = src + factor * atr
	lowerBand = src - factor * atr
	prevLowerBand = nz(lowerBand[1])
	prevUpperBand = nz(upperBand[1])

	lowerBand := lowerBand > prevLowerBand or close[1] < prevLowerBand ? lowerBand : prevLowerBand
	upperBand := upperBand < prevUpperBand or close[1] > prevUpperBand ? upperBand : prevUpperBand
	int direction = na
	float superTrend = na
	prevSuperTrend = superTrend[1]
	if na(atr[1])
		direction := 1
	else if prevSuperTrend == prevUpperBand
		direction := close > upperBand ? -1 : 1
	else
		direction := close < lowerBand ? 1 : -1
	superTrend := direction == -1 ? lowerBand : upperBand
	[superTrend, direction]
This custom function is exactly the same algorithm as the built-in function ta.supertrend, and of course the calculated indicator data is also exactly the same.
As we can see from this custom function algorithm, Pine’s built-in super trend indicator is calculated by using the hl2 built-in variable (the highest and lowest prices are added together and then divided by 2, that is, the average of the highest and lowest prices), and then the ATR indicator (volatility) is calculated for a certain period based on the parameter atrPeriod. Then the upper and lower tracks are constructed by using hl2 and ATR.
Update lowerBand and upperBand according to the ternary expressions in the code.
    lowerBand := lowerBand > prevLowerBand or close[1] < prevLowerBand ? lowerBand : prevLowerBand
    upperBand := upperBand < prevUpperBand or close[1] > prevUpperBand ? upperBand : prevUpperBand
lowerBand: lowerBand, used to determine if the upward trend has changed. upperBand: upperBand, used to determine if the downward trend has changed. lowerBand and upperBand are always calculated, only the current trend direction is determined at the end of this custom function.
    else if prevSuperTrend == prevUpperBand
        direction := close > upperBand ? -1 : 1
    else
        direction := close < lowerBand ? 1 : -1
Here it is judged that if the price value of the last BAR on the super trend is prevUpperBand, i.e. the upperBand, it means that the current is a downward trend. At this point, if the close exceeds the upperBand price breakout, the trend is considered to have shifted at this point and converted to an uptrend. The direction variable direction is set to -1 (uptrend). Otherwise it is still set to 1 (downward trend). That’s why you see in the super trend strategy if direction < 0 when the signal condition is triggered to go long. When direction > 0, the signal condition is triggered to go short.
    superTrend := direction == -1 ? lowerBand : upperBand
    [superTrend, direction]
Finally, specific Super Trend Indicator price data and direction data are returned based on the direction selection.
Dynamic balancing strategy
/*backtest
start: 2021-03-01 00:00:00
end: 2022-09-08 00:00:00
period: 1h
basePeriod: 15m
exchanges: [{"eid":"Binance","currency":"ETH_USDT"}]
args: [["v_input_1",4374],["v_input_2",3],["v_input_3",300],["ZPrecision",0,358374]]
*/

varip balance = input(50000, "balance")
varip stocks = input(0, "stocks")

maxDiffValue = input(1000, "maxDiffValue")


if balance - close * stocks > maxDiffValue and not barstate.ishistory
    // more balance , open long
    tradeAmount = (balance - close * stocks) / 2 / close
    strategy.order("long", strategy.long, tradeAmount)
    balance := balance - tradeAmount * close
    stocks := stocks + tradeAmount
    runtime.log("balance:", balance, ", stocks:", stocks, ", tradeAmount:", tradeAmount)

else if close * stocks - balance > maxDiffValue and not barstate.ishistory
    // more stocks , open short
    tradeAmount = (close * stocks - balance) / 2 / close
    strategy.order("short", strategy.short, tradeAmount)
    balance := balance + tradeAmount * close
    stocks := stocks - tradeAmount
    runtime.log("balance:", balance, ", stocks:", stocks, ", tradeAmount:", tradeAmount)

plot(balance, title="balance value(quoteCurrency)", color=color.red)
plot(stocks*close, title="stocks value(quoteCurrency)", color=color.blue)
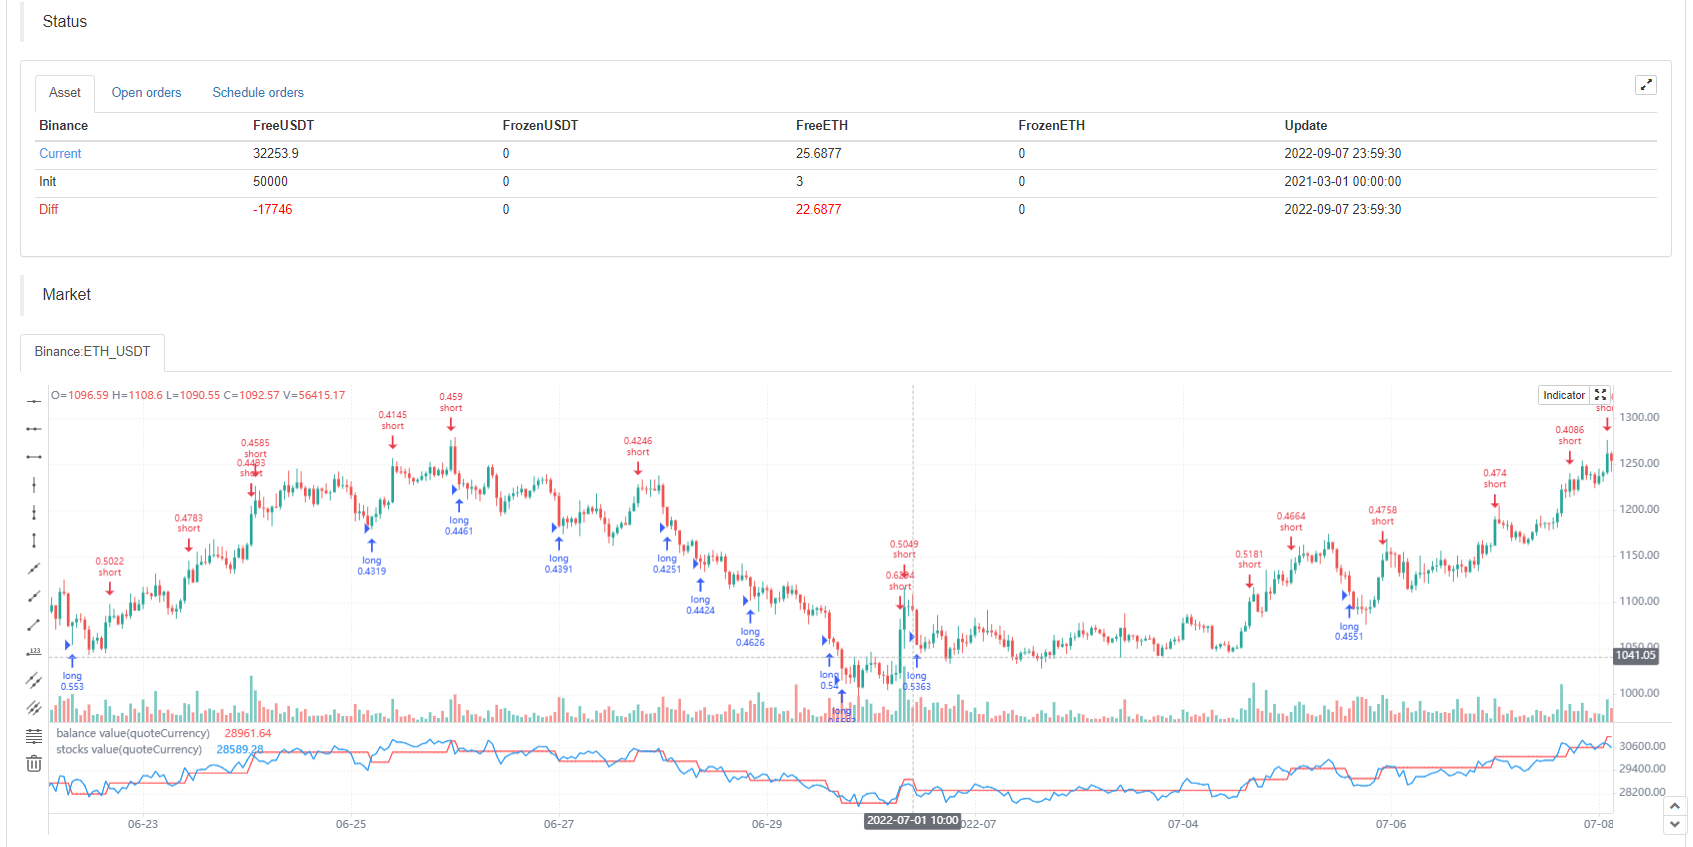
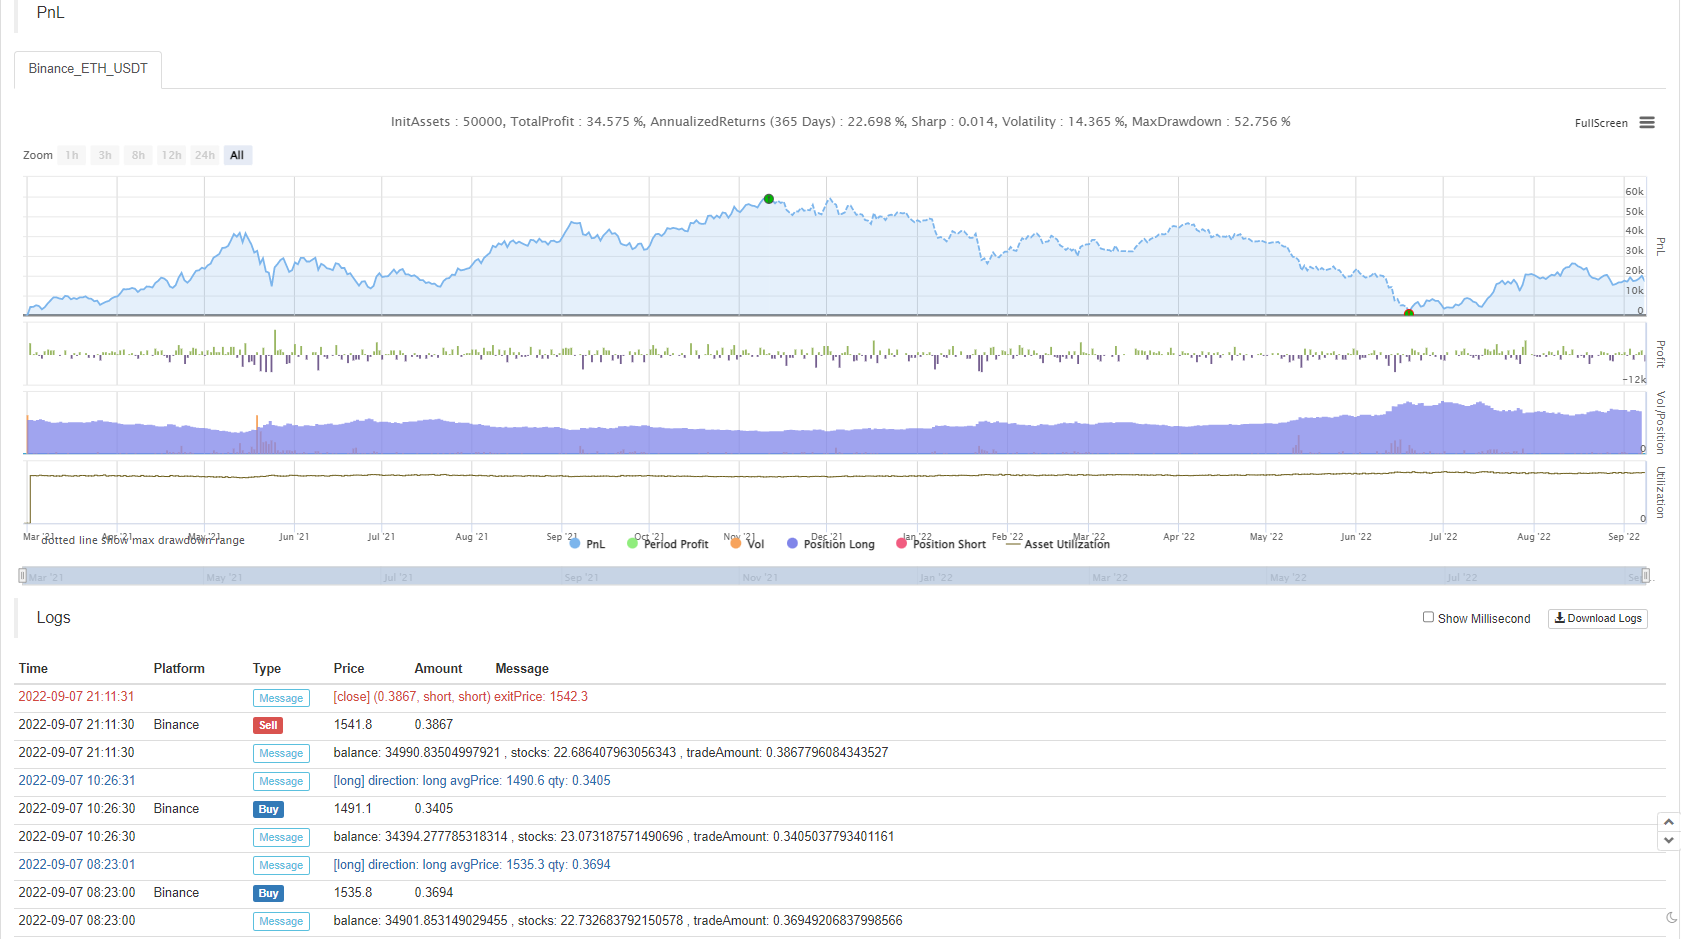
Let’s continue with some Pine language strategy design examples, this time we’ll learn a dynamic balancing strategy. A dynamic balancing strategy is one that always balances the amount of BaseCurrency and the amount of QuoteCurrency. Whichever asset’s relative price increases, the value held in the account increases and the asset is sold. If the relative price of an asset decreases, the value held in the account decreases and the asset is bought. This is known as a dynamic balancing strategy. In fact, the dynamic balance strategy is a kind of grid strategy that performs well in oscillating markets. But in the trend market, it will continue to lose money, we need to wait for the price to return to reduce losses slowly to profit, but the advantage is that the dynamic balancing strategy can always capture the oscillating trend of the market.
The disadvantage, as shown on the backtest chart of this strategy, is that the strategy has a large floating loss during the stage of the general price trend up (or down). So this strategy is fine for spot strategies, but you need to control the risk for futures.
Let’s look at the strategy code design:
We use a simplified design that simulates a balance (i.e., the number of QuoteCurrency assets) and stocks (i.e., the number of BaseCurrency assets) balance information in the strategy. We don’t read the real number of assets in the account, we simply use the simulated amount to calculate the appropriate buys and sells. Then the key parameter that affects the grid pulled by this dynamic balancing strategy is the maxDiffValue, which is the judgment criterion to carry out the balancing. At the current price, only when the deviation between BaseCurrency and QuoteCurrency exceeds maxDiffValue does the balancing process take place, selling the asset with a high price and buying the asset with a low price to rebalance the asset.
The strategy trading signal trigger must be in the real-time BAR stage, so if judgments in the strategy trading conditions are set with not barstate.ishistory. Buy when the balance value exceeds the stocks value based on the current price calculation. Conversely, a sell operation is performed. After executing the trade statement, the balance and stocks variables are updated and then await the next balance trigger.
The above information of the strategy backtest contains the price of the species at the start time of the strategy backtest, the price is 1458, so I set the parameter balance to: 4374 (1458*3) deliberately, set the parameter stocks to: 3. Let the asset start in balance.
Super Trend Strategy with Tracking Stop Loss and Take Profit
In the previous course, we have learned about the strategy.exit position exit function, of which we did not have an example to explain the tracking stop and take profit function. In this strategy design example, we will use the strategy.exit function to optimize a super trend strategy.
First let’s look at the tracking stop-loss and take-profit parameters of the strategy.exit function:
- Parameter
trail_price: The position that triggers the logical action of placing a tracking stop-loss and stop-loss close order (at the position specified by price). - Parameter
trail_offset: The distance from the highest (when going long) or lowest (when going short) price of a closed position placed after the execution of a tracking stop-loss and take-profit action. - Parameter
trail_points: Like thetrail_priceparameter, except that it takes profit points as the specified position.
Is that not easy to understand? It doesn’t matter! Let’s go through a strategy backtesting scenario to understand, which is actually quite simple.
/*backtest
start: 2022-09-23 00:00:00
end: 2022-09-23 08:00:00
period: 1m
basePeriod: 1m
exchanges: [{"eid":"Binance","currency":"ETH_USDT"}]
args: [["RunMode",1,358374],["ZPrecision",0,358374]]
*/

strategy("test", overlay = true)

varip a = na
varip highPrice = na
varip isTrade = false
varip offset = 30

if not barstate.ishistory and not isTrade
    strategy.entry("test 1", strategy.long, 1)
    strategy.exit("exit 1", "test 1", 1, trail_price=close+offset, trail_offset=offset)
    a := close + offset
    runtime.log("the price per point is:", syminfo.mintick, ", current close:", close)
    isTrade := true

if close > a and not barstate.ishistory
    highPrice := na(highPrice) ? close : highPrice
    highPrice := close > highPrice ? close : highPrice

plot(a, "trail_price trigger line")
plot(strategy.position_size>0 ? highPrice : na, "current highest price")
plot(strategy.position_size>0 ? highPrice-syminfo.mintick*offset : na, "moving stop trigger line")
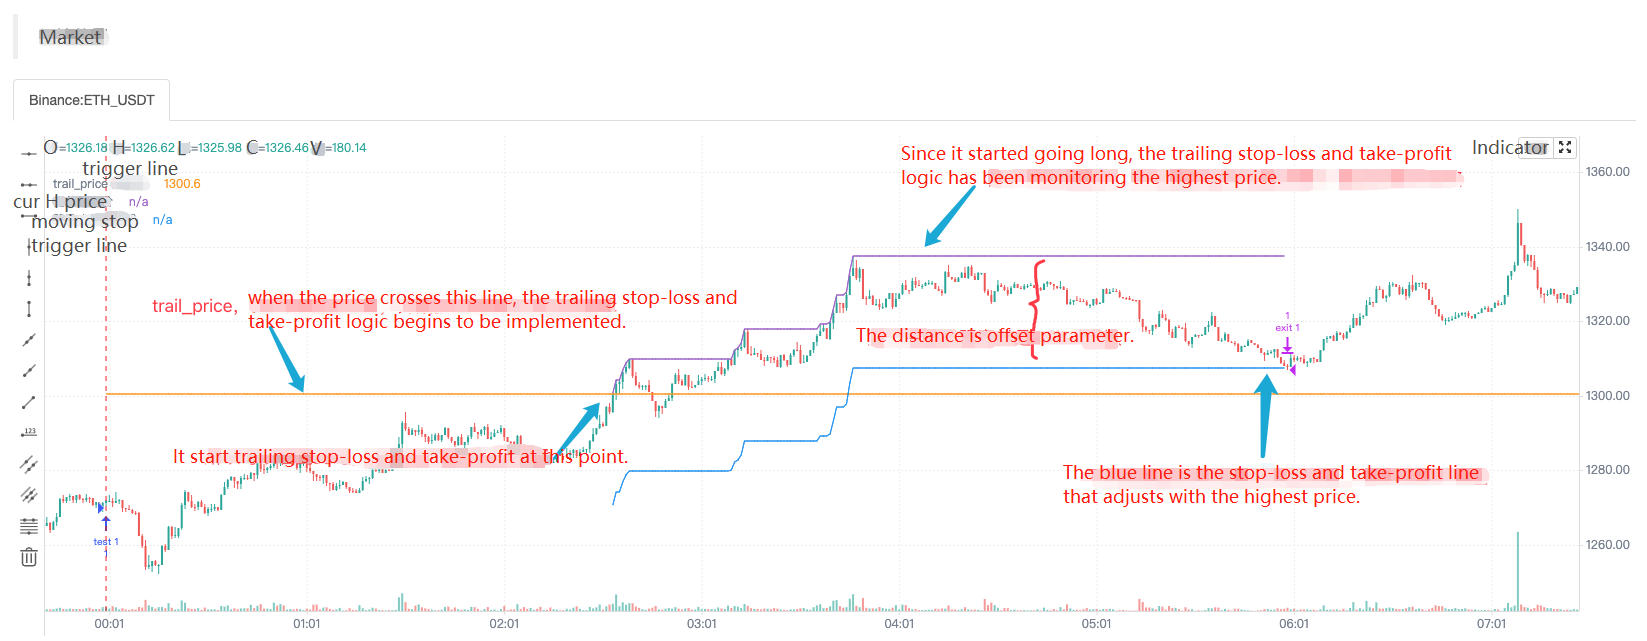
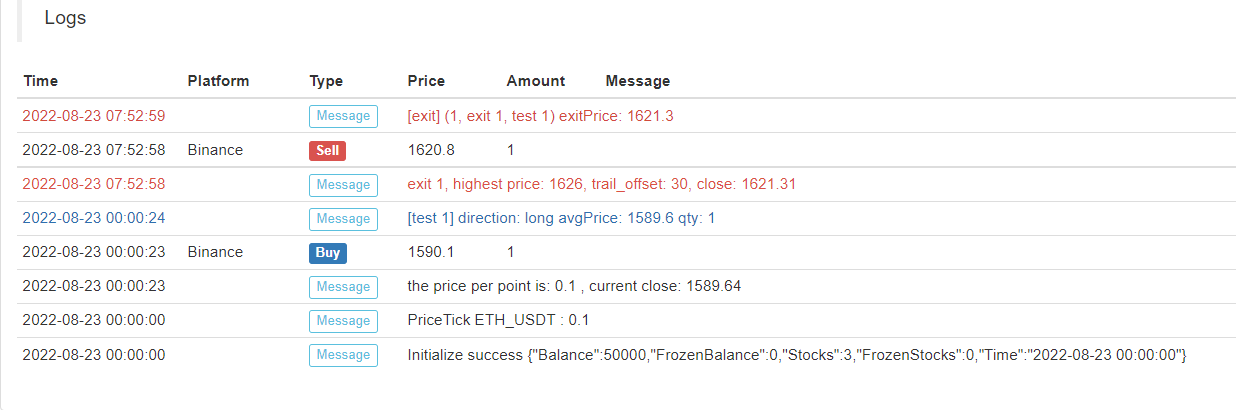
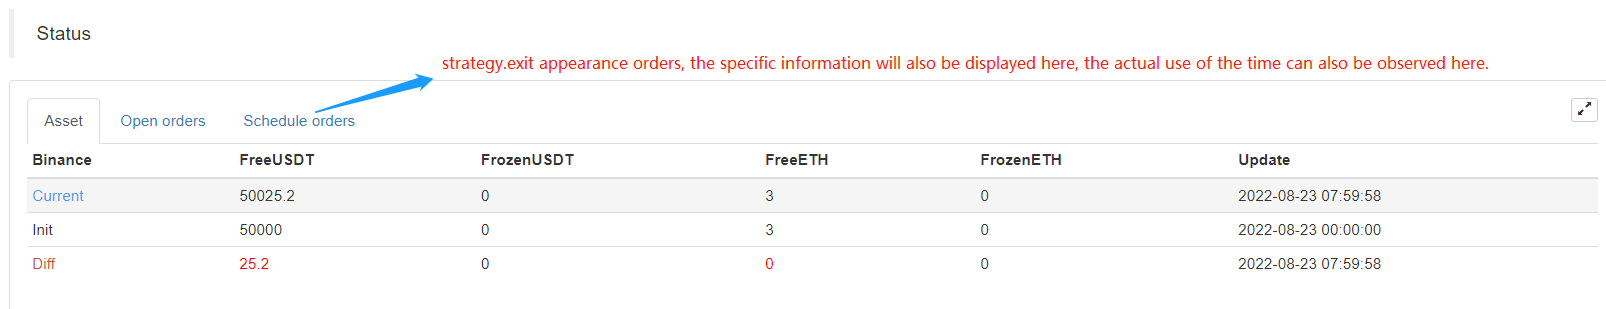
Immediate long entry when the strategy starts to execute, and then immediately placed a strategy.exit exit order (it specified the tracking stop-loss and take-profit parameters), when the price of the market change rose above the trail_price trigger line, the implementation of the trailing stop-loss and take-profit logic, stop-loss and take-profit line (blue) began to follow the highest price dynamic adjustment, the blue line position is the stop-loss and take-profit trigger to close the position, and finally when the market price falls below the blue line that triggers the closure of the position. Combined with the line drawn on the chart, it is very easy to understand.
Then we use this feature to optimize a super trending strategy, we simply assign a strategy.exit exit plan order to the strategy entry order to add this trailing stop-loss and take-profit feature.
if not barstate.ishistory and findOrderIdx("open") >= 0 and state == 1
    trail_price := strategy.position_size > 0 ? close + offset : close - offset
    strategy.exit("exit", "open", 1, trail_price=trail_price, trail_offset=offset)
    runtime.log("the price per point is:", syminfo.mintick, ", current close:", close, ",trail_price:", trail_price)
    state := 2
    tradeBarIndex := bar_index
Complete strategy code:
/*backtest
start: 2022-05-01 00:00:00
end: 2022-09-27 00:00:00
period: 1d
basePeriod: 5m
exchanges: [{"eid":"Binance","currency":"ETH_USDT"}]
args: [["RunMode",1,358374],["ZPrecision",0,358374]]
*/

varip trail_price = na
varip offset = input(50, "offset")
varip tradeBarIndex = 0
// 0 : idle , 1 current_open , 2 current_close
varip state = 0

findOrderIdx(idx) =>
    ret = -1
    if strategy.opentrades == 0
        ret
    else
        for i = 0 to strategy.opentrades - 1
            if strategy.opentrades.entry_id(i) == idx
                ret := i
                break
        ret

if strategy.position_size == 0
    trail_price := na
    state := 0

[superTrendPrice, dir] = ta.supertrend(input(2, "atr coefficient"), input(20, "atr period"))

if ((dir[1] < 0 and dir[2] > 0) or (superTrendPrice[1] > superTrendPrice[2])) and state == 0 and tradeBarIndex != bar_index
    strategy.entry("open", strategy.long, 1)
    state := 1
else if ((dir[1] > 0 and dir[2] < 0) or (superTrendPrice[1] < superTrendPrice[2])) and state == 0 and tradeBarIndex != bar_index
    strategy.entry("open", strategy.short, 1)
    state := 1


// Reverse signal, close all positions
if strategy.position_size > 0 and dir[2] < 0 and dir[1] > 0
    strategy.cancel_all()
    strategy.close_all()
    runtime.log("trend reversal, long positions all closed")
else if strategy.position_size < 0 and dir[2] > 0 and dir[1] < 0
    strategy.cancel_all()
    strategy.close_all()
    runtime.log("trend reversal, short positions all closed")


if not barstate.ishistory and findOrderIdx("open") >= 0 and state == 1
    trail_price := strategy.position_size > 0 ? close + offset : close - offset
    strategy.exit("exit", "open", 1, trail_price=trail_price, trail_offset=offset)
    runtime.log("the price per point is:", syminfo.mintick, ", current close:", close, ", trail_price:", trail_price)
    state := 2
    tradeBarIndex := bar_index


plot(superTrendPrice, "superTrendPrice", color=dir>0 ? color.red : color.green, overlay=true)
- 关于回测手续费计算方式
- 永续合约 持仓问题
- 请教一个画线类库的问题
- 有没有月化20-30的马丁加仓思路 好用红包安排
- 一分钟k线中如何买卖在最高点
- pine script 变量值问题
- ema计算问题
- 又来新问题了,关于多币种下单
- 求助,GetDepth获取数据的时间频率等问题
- exchange.SetPrecision(2, 3) 这两个是永续交易里面的哪两个字段 起什么作用呢?
- 服务器自动更新完阿里云linux系统后 使用托管者报错
- 为啥我这下不了单啊
- 回测 币安期货 ----- 品种订阅失败 BTC_USDT_Futures_Binance
- 寻找个JS语言大神
- 请问大家币安API怎么获取单笔订单的实现盈亏呀
- 请问一个服务器可以部署多个托管者么?
- 指标库(python版)
- 趋势判断相关问题
- ETH2.0来袭,有什么致富机会?可以来套保ETH,赢分叉币糖果空投
- 求助