
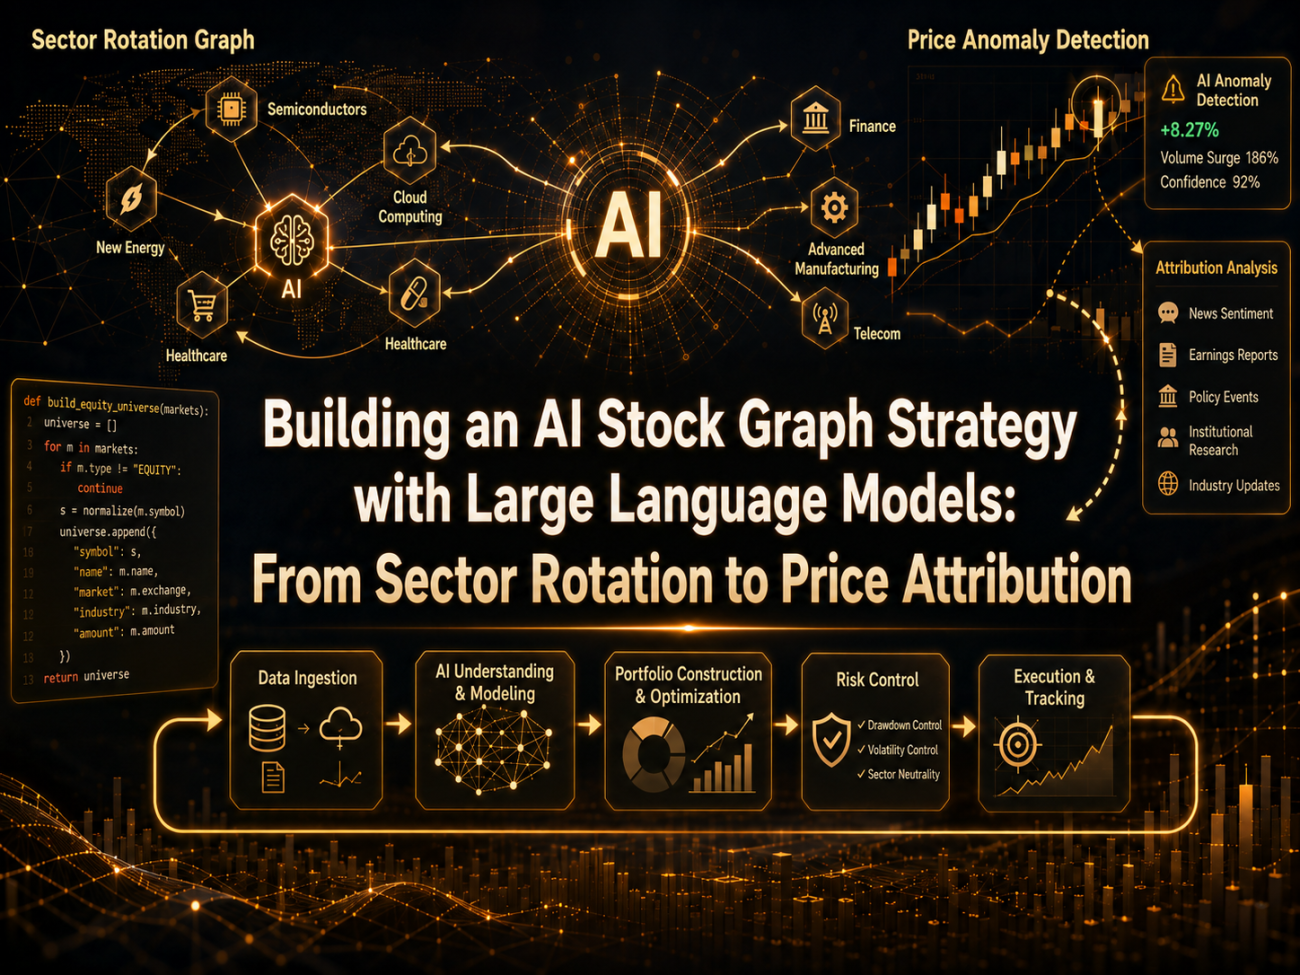
AI has been incredibly hot lately.
Over the past two years, the strongest market themes have, one way or another, revolved around AI. NVIDIA, AMD, Broadcom, TSMC, Micron, Microsoft, Google, Meta, CoreWeave, Supermicro... Every once in a while, one of these companies suddenly surges because of keywords such as earnings, orders, capital expenditure, HBM, GPUs, cloud computing, or data centers.
What is even more interesting is that they often do not rise in isolation.

Sometimes NVIDIA moves first, and then the market starts digging into ASICs, optical modules, servers, liquid cooling, and power. Sometimes Micron reports better-than-expected earnings, and capital then starts looking at HBM, memory, semiconductor equipment, and advanced packaging. Sometimes cloud providers raise their capital expenditure guidance, and the entire AI infrastructure chain gets repriced.
This looks more like asset rotation within the AI theme. The market is not simply buying one stock. Instead, under one big narrative, it keeps looking for new branches, new explanations, and new catch-up targets.
Then comes the problem: if all these relationships have to be organized manually, it is simply too tiring.
One person may know NVIDIA, AMD, Micron, Microsoft, and Google, but it is difficult to continuously track the business changes, news updates, sector classification, and price linkage of dozens or even hundreds of TradFi stock contracts. What makes it even more complicated is that many companies do not have only one attribute. Google is AI cloud, Gemini, and an advertising platform at the same time. Microsoft is cloud, Copilot, and enterprise software. Broadcom has ASICs, networking chips, and exposure to AI data centers.
So I started trying something:
Can we let a large language model help us build an AI stock graph?
The goal is not to let the large language model directly tell us what to buy. Instead, it should do what it is better at: understanding company businesses, classifying AI sub-sectors, organizing news, explaining events, and judging which stocks under the same theme may be affected by one company’s price anomaly. The real trading decisions should still be left to price, statistics, and risk control.
First, Put Stocks into the Right Basket
The first step of the strategy is not trading, but building the graph.
There are now quite a few TradFi stock contracts on the exchange. We can directly obtain a batch of stock contracts such as NVDA, AMD, MU, MSFT, GOOGL, and SMCI. The system first filters stock contracts and keeps only real EQUITY instruments.
There is one very important detail here: ETFs, indices, and leveraged ETFs cannot be mixed in. For example, QQQ, SOXL, and EWT may also appear in the contract list, but they are not company stocks. If they are placed into the AI stock basket, the later statistical relationships will be polluted.
The core filtering logic looks roughly like this:
python
def refresh_equity_universe(store, force_reanalyze):
ms = exchange.GetMarkets()
symbols = []
for key, market in ms.items():
info = market.get("Info", {}) or {}
sub_type = info.get("underlyingSubType", []) or []
underlying_type = info.get("underlyingType", "")
if ".swap" not in key:
continue
if "TradFi" not in sub_type:
continue
if underlying_type != "EQUITY":
continue
symbol = normalize_symbol(key)
store["markets"][symbol] = {
"symbol": symbol,
"contract": key,
"underlyingType": underlying_type,
"amountPrecision": market.get("AmountPrecision", 0),
"pricePrecision": market.get("PricePrecision", 2),
"ctVal": market.get("CtVal", 1) or 1,
"minQty": market.get("MinQty", 0) or 0,
}
symbols.append(symbol)
After obtaining the stock universe, the system asks the large language model to create a profile for each stock.
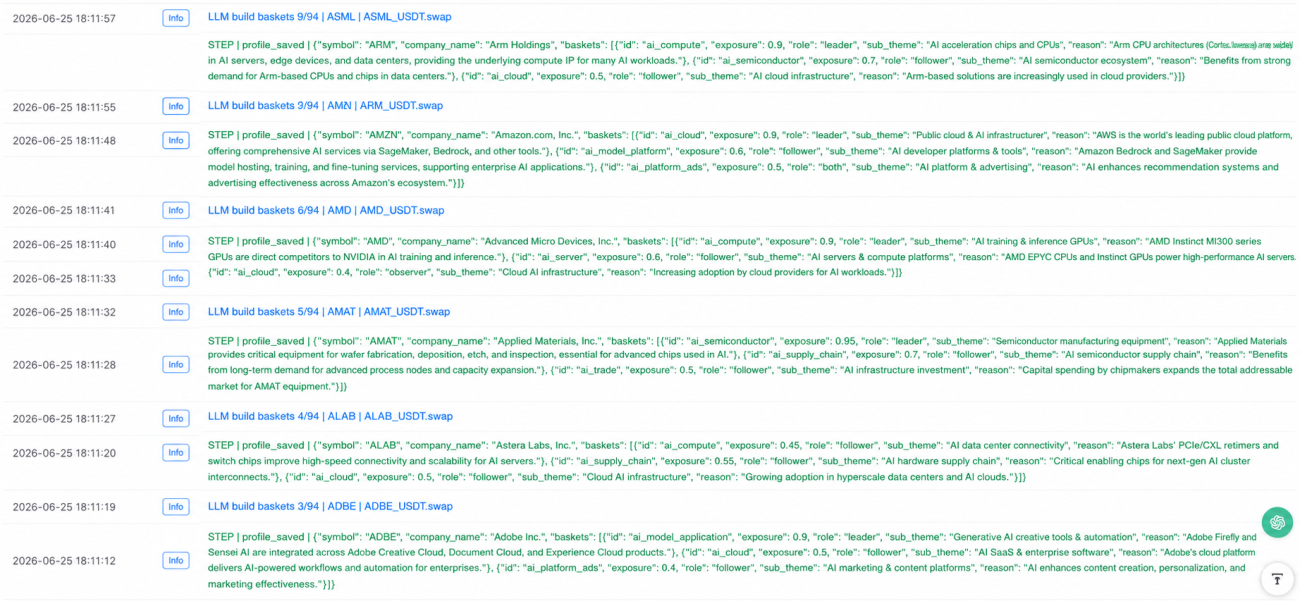
The profile is not simply a sentence like “this is a technology stock.” Instead, it needs to determine which AI sub-sectors the stock belongs to. For example, one stock can belong to multiple baskets at the same time. Google can belong to AI cloud, AI model applications, and AI platform advertising. Microsoft can belong to AI cloud and enterprise AI applications. NVIDIA can belong to AI computing power and AI servers. Micron can belong to AI memory.
The key point of this step is: in the AI era, stocks are not single-label assets. They are multi-label assets.
Each stock carries several attributes: which baskets it belongs to, how high its exposure is, whether it is more like a leader or a follower in that basket, which companies may affect it, and which companies it may affect.
I gave the large language model a strongly constrained output structure:
            python

            schema = {
    "symbol": symbol,
    "asset_type": "stock|adr|etf|leveraged_etf|index|fund|other",
    "company_name": "",
    "sector": "",
    "business_summary": "",
    "tradable": False,
    "model_confidence": 0,
    "baskets": [
        {
            "id": "ai_cloud",
            "exposure": 0.0,
            "role": "leader|follower|both|observer",
            "sub_theme": "",
            "reason": ""
        }
    ],
    "search_names": [],
    "event_keywords": [],
    "negative_keywords": [],
    "possible_leaders": [],
    "possible_followers": [],
    "brave_queries": [],
    "reason": ""
}
The most important field here is asset_type. Only stock and adr can enter a basket. ETFs, leveraged ETFs, indices, funds, commodities, and regional ETFs are filtered out directly.
In addition, reason must be written in Chinese, field names must remain consistent, and confidence must be normalized to a range from 0 to 100. Otherwise, the live trading dashboard will look very messy later.
Sector Information Cannot Rely on Guesswork
Stock classification alone is not enough.
The AI sector changes too quickly. Today the market may be speculating on GPUs. Tomorrow it may move to HBM. The day after that it may move to optical modules. A few days later, it may start trading liquid cooling, power, or cloud provider capital expenditure.
If the system relies only on the large language model’s own knowledge, it can easily become outdated. So the system also needs a real-time information source.
Here I connected BraveSearch. The system periodically searches for sector information for each AI basket, and also searches for news about key stocks inside each basket.
For example, the AI memory basket will look at keywords such as Micron, Western Digital, SanDisk, HBM, DRAM, and NAND. The AI optical communication basket will look at information such as Ciena, Credo, Lumentum, AAOI, 800G, and 1.6T optical modules.
The core process for basket intelligence is:
            python

            def refresh_basket_intelligence(store):
    if not BRAVE_KEY:
        return
    if not LLM_API_KEY:
        return

    intel = {}

    for bid, basket in store["baskets"].items():
        members = sorted(
            basket["members"],
            key=lambda x: x.get("exposure", 0),
            reverse=True
        )
        top_symbols = [m["symbol"] for m in members[:8]]

        basket_news = fetch_basket_news(basket, top_symbols)
        stock_news = {}

        for symbol in top_symbols[:6]:
            profile = store["profiles"].get(symbol, {})
            stock_news[symbol] = fetch_stock_news(profile, bid)
            Sleep(800)

        analysis = analyze_basket_intel_with_llm(
            store, basket, top_symbols, basket_news, stock_news
        )

        if analysis:
            analysis["basket"] = bid
            analysis["basket_name"] = basket["name"]
            analysis["symbols"] = top_symbols
            analysis["updatedAt"] = int(time.time())
            intel[bid] = analysis

    store["basket_intel"] = intel
The role of this step is to build a dynamic background for each AI sub-sector.
Based on the news pulled by BraveSearch, the large language model outputs the sector trend, core catalysts, core risks, candidate leaders, candidate followers, and relationships that need to be validated later.
This is different from directly asking the large language model, “What do you think about AI memory?” Here, we first feed it real-time news, and then let it summarize.
It Is Not News-Driven Trading; Price Abnormality Comes First
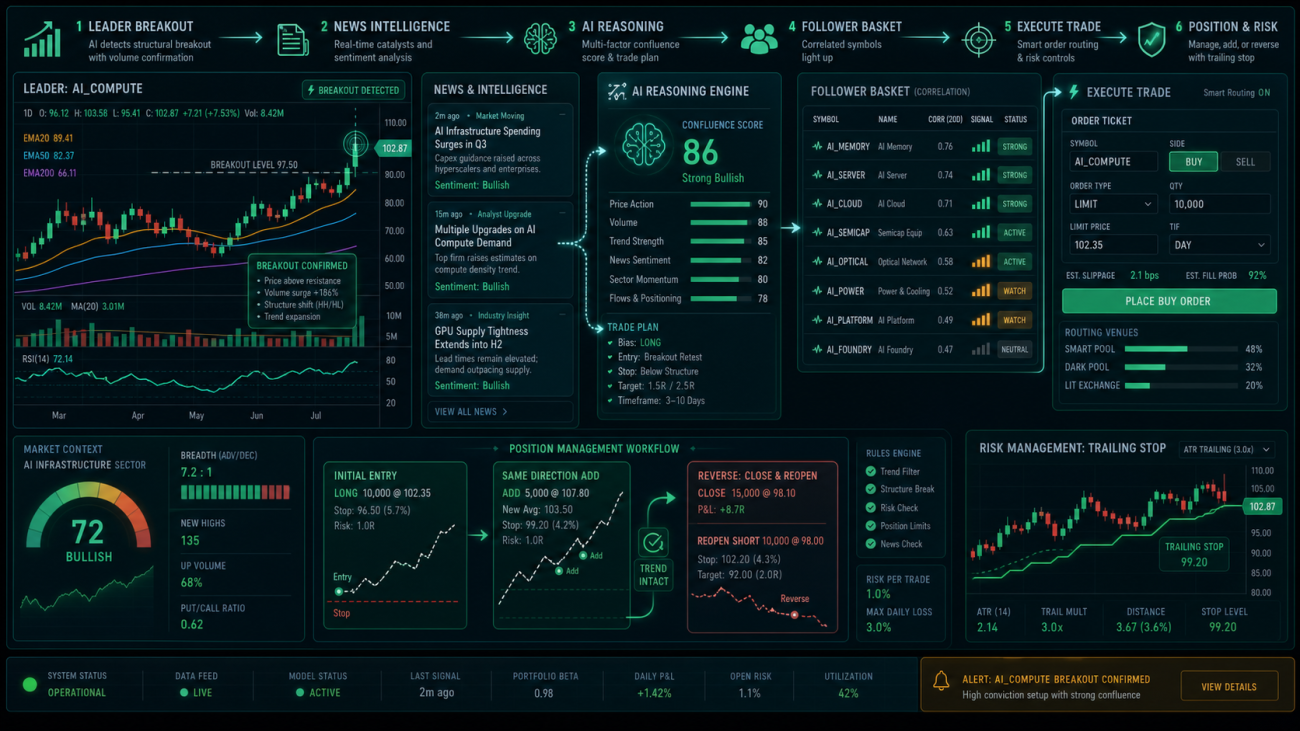
At first, I also considered a news-driven approach.
For example, when a company reports better-than-expected earnings, the system could ask the large language model which stocks may benefit, and then directly generate a signal. But after thinking about it carefully, this path is very noisy. There is too much news. Many news items look important, but the market simply does not care.
So I reversed the logic.
Look at price first, then look at news.
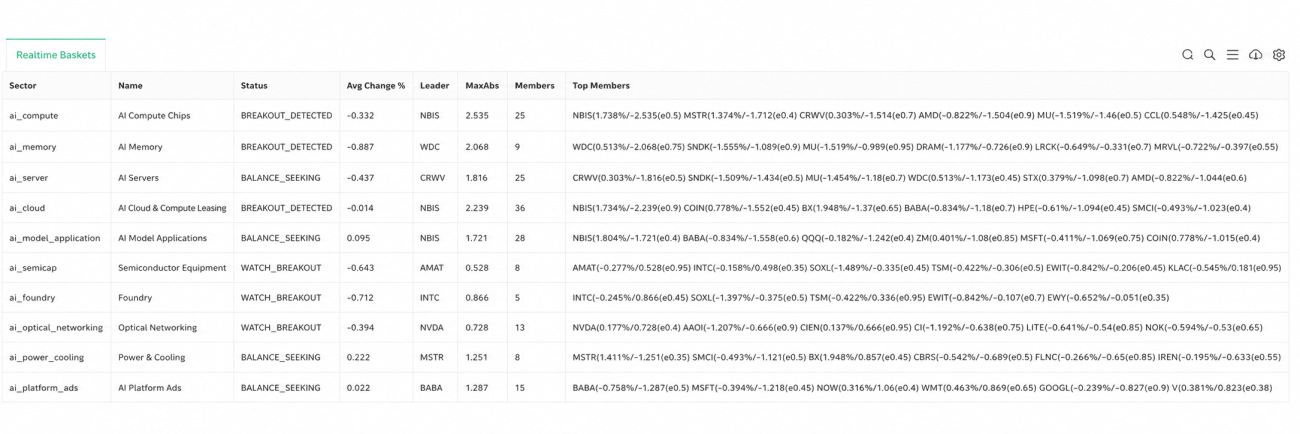
If all stocks inside a basket are relatively stable, the system only observes. Only when one stock clearly deviates from the average performance of the basket and becomes the current leader will the system ask:
Why did it move?
This step uses the ZScore inside the basket.
In simple terms, it checks whether one stock is abnormally strong or abnormally weak relative to other stocks in the same basket. If one stock suddenly breaks out while other stocks in the same basket have not yet reacted, there may be a diffusion opportunity.
The core logic for calculating basket ZScore is as follows:
            python

            def calc_basket_zscores(store, symbols):
    returns = {}
    min_len = 999999

    for symbol in symbols:
        bars = get_records(
            store["markets"][symbol]["contract"],
            KLINE_PERIOD,
            SYNC_WINDOW + 10
        )
        if len(bars) < SYNC_WINDOW + 2:
            return None

        r = calc_returns(bars)[-SYNC_WINDOW:]
        returns[symbol] = r
        min_len = min(min_len, len(r))

    latest = {s: returns[s][-1] for s in symbols}
    avg_latest = mean(list(latest.values()))
    dev_series = {s: [] for s in symbols}

    for i in range(min_len):
        row = [returns[s][-min_len + i] for s in symbols]
        row_avg = mean(row)
        for s in symbols:
            dev_series[s].append(returns[s][-min_len + i] - row_avg)

    zscores = {}
    max_abs = 0
    for s in symbols:
        sigma = std(dev_series[s])
        z = (latest[s] - avg_latest) / sigma if sigma > 0 else 0
        zscores[s] = round(z, 3)
        max_abs = max(max_abs, abs(z))

    return {"zscores": zscores, "maxAbs": max_abs}
If the maximum deviation of a basket exceeds the breakout threshold, the system enters the BREAKOUT_DETECTED state.
At this point, the system does not trade immediately. Instead, it starts looking for the cause.
News Is Responsible for Explanation; Statistical Relationships Are Responsible for Validation
After the leader shows a price breakout, the system fetches its latest news and then asks the large language model to determine whether the news can explain the price anomaly.
But this is not simply asking, “Is this news bullish?”
The system sends the current basket, sector intelligence, real-time price state, the leader’s ZScore, candidate followers, already validated statistical relationships, and news pulled by BraveSearch to the large language model together.
The large language model needs to answer:
(1) Whether this news can explain the leader’s price anomaly.
(2) Whether the news direction is consistent with the price direction.
(3) Whether trading is allowed.
(4) Which followers are affected.
(5) How large the impact is on each follower.
(6) Why these followers may be affected.
The core attribution logic is as follows:
            python

            def explain_breakout_with_news(store, bid, leader, direction, leader_z, followers, edges):
    if not BRAVE_KEY:
        return None
    if not LLM_API_KEY:
        return None

    profile = store["profiles"].get(leader, {})
    news = fetch_stock_news(profile, bid)
    if not news:
        return None

    event = analyze_breakout_news_with_llm(
        store, bid, leader, direction, leader_z,
        followers, edges, news
    )
    if not event:
        return None

    if not event.get("explains_price_move"):
        return None

    expected_direction = "bullish" if direction == "long" else "bearish"
    if event.get("direction") != expected_direction:
        return None

    event["confidence"] = normalize_confidence(event.get("confidence", 0))
    if event["confidence"] < MIN_NEWS_CONFIDENCE:
        return None

    if not event.get("trade_allowed"):
        return None

    return event
But even if the large language model says that a certain follower may be affected, the system still cannot trade immediately.
It also needs to check the K-line statistical relationship.
Inside each basket, the system calculates historical linkages between stocks. For example: after the source breaks out, does the target often follow? What is the correlation? What is the best lag period? What is the average follow-up return?
Only a source -> target relationship that passes the statistical filter becomes an active edge.
            python

            def rebuild_basket_stats(store):
    edges = []

    for bid, basket in store["baskets"].items():
        symbols = [
            m["symbol"] for m in basket["members"]
            if m["symbol"] in store["markets"]
        ]

        for source in symbols:
            for target in symbols:
                if source == target:
                    continue

                metric = validate_pair(store, source, target)
                if not metric:
                    continue

                source_exp = basket_member_info(basket, source).get("exposure", 0)
                target_exp = basket_member_info(basket, target).get("exposure", 0)

                score = clamp(
                    metric["corr"] * 0.3 +
                    metric["follow"] * 0.4 +
                    min(source_exp, target_exp) * 0.3,
                    0, 1
                )

                edge = {
                    "basket": bid,
                    "source": source,
                    "target": target,
                    "corr": round(metric["corr"], 3),
                    "follow": round(metric["follow"], 3),
                    "lag": metric["lag"],
                    "avgReturn": round(metric["avgReturn"], 6),
                    "sample": metric["sample"],
                    "score": round(score, 3),
                    "active": (
                        score >= MIN_EDGE_SCORE and
                        metric["corr"] >= MIN_CORR and
                        metric["follow"] >= MIN_FOLLOW_SUCCESS
                    ),
                    "updatedAt": int(time.time()),
                }
                edges.append(edge)

    store["edges"] = edges
This step is very important.
Large language models are good at understanding logic, but the market does not necessarily move according to logic. Statistical relationships are used to verify whether this logic has actually been traded by the market in the past.
The Strategy Trades Diffusion, Not Chasing the High
This strategy is not designed to chase the leader.
The leader has already broken out. If we buy it directly, it can easily become chasing at a high price. What the strategy really wants to capture is the diffusion opportunity inside the same AI basket.
In other words: the leader has already moved, and the news makes sense, but some followers have not fully reacted yet. If these followers have indeed shown linkage with the leader historically, there may be a short-term follow-up opportunity.
During breakout scanning, the system first looks for active edges, and then looks for lagging followers:
            python

            def scan_price_breakouts(store):
    for bid, rt in store["realtime"].items():
        if rt["state"] != "BREAKOUT_DETECTED":
            continue

        leader = rt["leader"]
        z = 0
        for m in rt["members"]:
            if m["symbol"] == leader:
                z = m["z"]

        direction = "long" if z > 0 else "short"

        edges = [
            e for e in store["edges"]
            if e["active"] and e["basket"] == bid and e["source"] == leader
        ]

        followers = []
        for e in edges:
            target_rt = find_realtime_member(rt, e["target"])
            if target_rt and abs(target_rt["z"]) < BREAKOUT_THRESHOLD * 0.75:
                followers.append(e["target"])

        if not followers:
            continue
Only after the news attribution also passes will the system generate a confirmed signal.
The main trading targets are the followers.
If there is no current position, the system opens a position according to the signal direction. If the same contract already has a position in the same direction, it adds to the position. If there is already a position in the opposite direction, it first closes the position, and then opens a new position in the new direction.
            python

            def execute_symbol_trade(store, signal, symbol, detail):
    direction = signal["direction"]

    if TRADE_MODE != "trade":
        return open_or_add_position(store, signal, symbol, detail, add_mode=False)

    pos = get_position_by_symbol(symbol)
    if pos:
        pos_dir = position_direction(pos)

        if pos_dir == direction:
            return open_or_add_position(store, signal, symbol, detail, add_mode=True)

        close_existing_position(store, symbol, pos, "reverse_signal")
        Sleep(1000)

    return open_or_add_position(store, signal, symbol, detail, add_mode=False)
This is also because many stocks may appear in multiple baskets at the same time. A stock may be a follower in the AI cloud basket, while also being a member of another AI application logic. Signals from different baskets may affect it at the same time, so the direction of the same contract needs to be handled in a unified way.
Risk Control Is Simple for Now, But It Must Exist
In terms of risk control, the current system uses a hard stop-loss and a trailing stop.
If the loss reaches the threshold, the position exits. After profit reaches a certain level, the trailing stop is activated. If the position gives back too much from the highest floating profit, the system exits to lock in profit.
            python

            def monitor_positions(store):
    for pos in exchange.GetPosition() or []:
        symbol = position_symbol(pos)
        if symbol not in store["markets"]:
            continue

        state = _G(position_state_key(symbol)) or {}
        market = store["markets"][symbol]
        ticker = exchange.GetTicker(market["contract"])

        direction = position_direction(pos)
        pnl_pct = (
            (ticker["Last"] - pos["Price"]) /
            pos["Price"] * 100 *
            (1 if direction == "long" else -1)
        )

        if pnl_pct > state.get("peakPnlPct", 0):
            state["peakPnlPct"] = pnl_pct

        if not state.get("trailActive") and state.get("peakPnlPct", 0) >= TRAIL_ACTIVATE_PCT:
            state["trailActive"] = True

        hard_stop = False
        if state.get("stop"):
            hard_stop = (
                ticker["Last"] <= state["stop"]
                if direction == "long"
                else ticker["Last"] >= state["stop"]
            )

        trail_hit = False
        if state.get("trailActive"):
            giveback = state.get("peakPnlPct", 0) - pnl_pct
            allowed = max(
                1.5,
                state.get("peakPnlPct", 0) * TRAIL_GIVEBACK_PCT / 100.0
            )
            trail_hit = giveback >= allowed

        if hard_stop or trail_hit:
            close_existing_position(
                store, symbol, pos,
                "hard_stop" if hard_stop else "trailing_stop"
            )
This is not the final version of the risk control system, but it is already enough for the first version of live observation.
Later, account-level total position limits, single-sector exposure limits, daily loss limits, execution confirmation, and limits on the number of add-ons still need to be added.
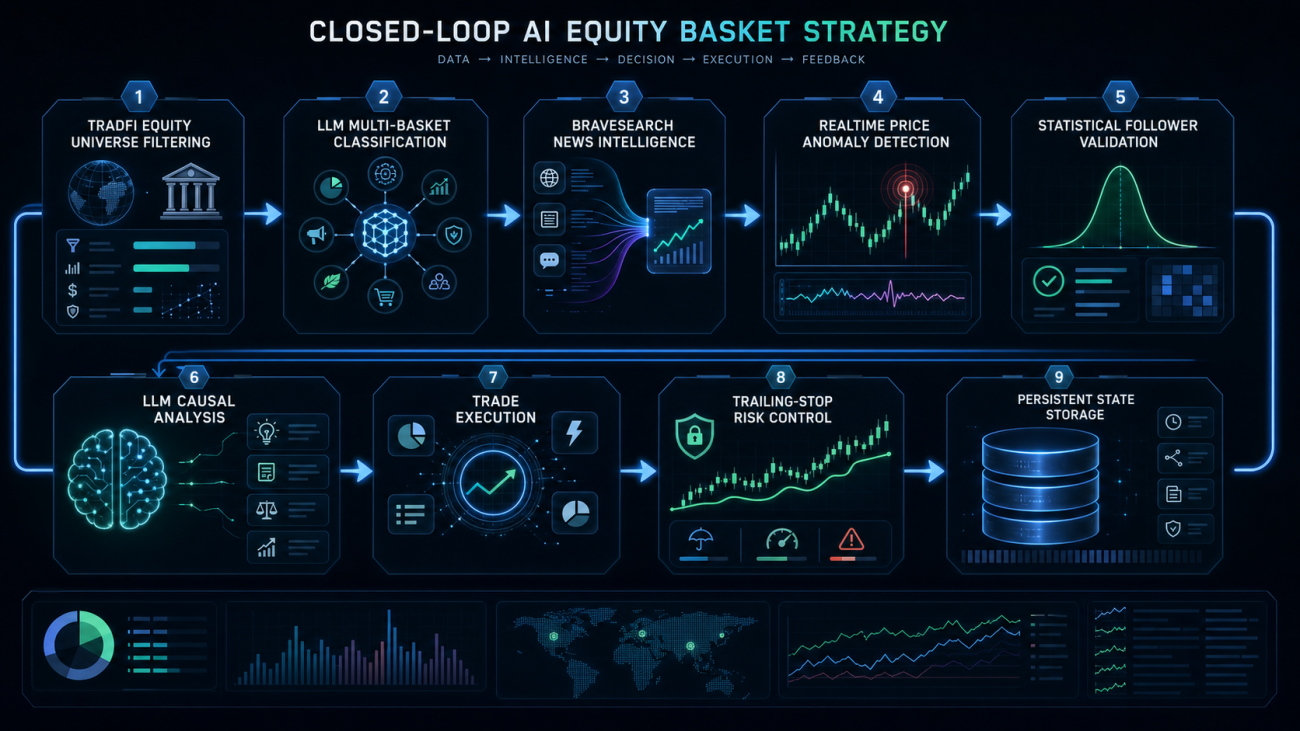
What the System Can Do Now
At this stage, the system can already complete a relatively full research loop.
It can automatically scan TradFi stock contracts, automatically ask the large language model to create multi-basket stock profiles, automatically build AI sub-sectors, automatically pull sector and stock information through BraveSearch, automatically summarize sector intelligence, automatically detect real-time strength and weakness inside each basket, automatically calculate follow relationships between stocks inside each basket, and perform news attribution after the leader price breakout.
If the news explanation holds, the direction is consistent, and the statistical relationship also supports it, the system will generate a confirmed signal. By default, it only sends notifications and does not trade live. It will trade only after switching to trade mode.
The live trading page is no longer just a log page. It displays the system overview, real-time basket status, sector intelligence, recent signals, recent trades, and recent steps in tables. This makes it easier to see where the system is stuck: whether there is only price abnormality, whether the news fails to explain the move, whether the follower does not satisfy the conditions, or whether risk control blocks the trade.
What Is Still Immature
To be honest, this system cannot yet be considered a mature automated trading strategy.
It is more like an AI theme rotation research framework. It can already connect stock profiling, sector intelligence, price abnormality, news attribution, statistical validation, and trading signals, but it still needs further validation.
The areas that need the most improvement are as follows.
(1) Stock profile quality. The large language model may sometimes place marginal stocks into a basket, so asset_type must be strictly enforced to prevent ETFs, indices, and regional funds from being mixed in.
(2) News quality. The news captured by BraveSearch is not necessarily always the core news. The model needs to judge which news items can truly explain the price move.
(3) Statistical relationships. Historical follow relationships do not mean they will definitely remain valid in the future. They need continuous review.
(4) Trading risk control. Before enabling automatic trade mode, account-level positions, sector exposure, daily loss limits, and execution confirmation must be added.
So for now, it is more suitable to run in notify mode first and observe the quality of confirmed signals.
If, after a period of observation, the signals can indeed explain market anomalies and the followers often react afterward, then small-position live trading can be considered.
Final Notes
This strategy is not about letting AI place orders directly.
I have always believed that the most suitable role for large language models in a trading system is not “tell me what to buy,” but helping us process information structures that are difficult for humans to maintain continuously: company businesses, sector classification, real-time news, event explanations, capital rotation paths, and potential affected targets.
Real trading should still be left to price, statistics, and risk control.
In the AI era, a quantitative strategy should not simply add one more large language model API. Instead, it should connect real-time data, thematic graphs, news events, price structure, trade execution, and post-trade review into one system.
This AI stock graph strategy is one experiment along this direction.
Strategy source code: AI Industry Chain TradFi Contract Graph Trading System
- 1