
কৌশল অঙ্কন নকশা সহজতর করতে KLineChart ফাংশন ব্যবহার করুন
কৌশল ডিজাইন করার সময়, জাভাস্ক্রিপ্ট বা পাইথন ব্যবহার করে কৌশল লেখার সময় প্রায়ই কৌশল চার্ট ডিসপ্লে ডিজাইন করা প্রয়োজন। যে ব্যবহারকারীরা প্রোগ্রামিং বা FMZ প্ল্যাটফর্মের দ্বারা ব্যবহৃত চার্ট লাইব্রেরির সাথে পরিচিত নন তারা প্রায়ই কাস্টম চার্টে ছবি আঁকার জন্য কোড ডিজাইন দ্বারা সমস্যায় পড়েন। তাহলে কিভাবে আপনি অল্প পরিমাণ কোড লিখতে পারেন এবং একটি সমৃদ্ধ কৌশল চার্ট আঁকতে পারেন?
এই সহজ কিন্তু শক্তিশালী অঙ্কন পদ্ধতিটি পাইন ভাষায় দেখা যায়, যা তার সমৃদ্ধ অঙ্কন ফাংশনের জন্য বিখ্যাত। যদি পাইন ভাষার অঙ্কন ইন্টারফেস জাভাস্ক্রিপ্ট এবং পাইথন ভাষার কৌশলগুলির সাথে সংযুক্ত করা যায় তবে এটি কৌশলগুলি ডিজাইন করার ক্ষেত্রে বিকাশকারীদের অঙ্কন ফাংশনকে ব্যাপকভাবে সহজ করবে। অতএব, এই চাহিদার উপর ভিত্তি করে, FMZ প্ল্যাটফর্ম কাস্টম অঙ্কন ফাংশন আপগ্রেড এবং এর ব্যবহার প্রসারিত করেছেKLineChartফাংশনটি কাস্টম চার্ট অঙ্কন সম্পাদন করে। আপনি API ডকুমেন্টেশনটি দেখতে পারেন: https://www.fmz.com/api#klinechart
ট্রানজিশন করার জন্য প্রথমে জাভাস্ক্রিপ্ট ভাষা ব্যবহার করে একটি সহজ উদাহরণ লিখি।
সহজ উদাহরণ
javascript
/*backtest
start: 2022-03-21 09:00:00
end: 2022-06-21 15:00:00
period: 30m
basePeriod: 15m
exchanges: [{"eid":"Binance","currency":"BTC_USDT"}]
*/
function main() {
var c = KLineChart()
while (true) {
var bars = _C(exchange.GetRecords)
for (var i = 0 ; i < bars.length ; i++) {
var bar = bars[i]
c.begin(bar)
c.plot(bar.Volume, "volume")
c.close()
}
Sleep(1000)
}
}
এই উদাহরণটি খুবই সহজ এটি কৌশলটির কাস্টম অঙ্কন এলাকায় কে-লাইন চার্ট আঁকে এবং চার্টের সাব-ইমেজ অবস্থানে প্রতিটি কে-লাইন বার-এর সাথে সম্পর্কিত ভলিউম বক্ররেখা আঁকে।
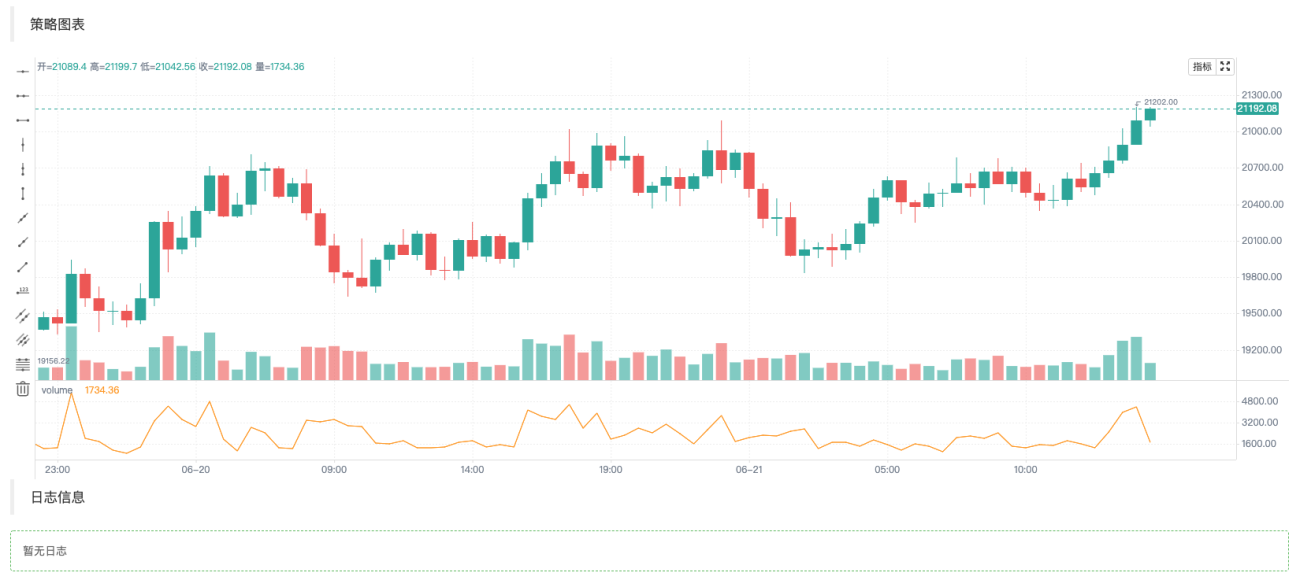
কোডে আমরা প্রথমে ব্যবহার করিvar c = KLineChart()একটি চার্ট অবজেক্ট তৈরি করুন এবং তারপর আঁকার জন্য এর পদ্ধতিগুলি ব্যবহার করুন। তারপর লুপে, আমরা কে-লাইন ডেটা (অ্যারে স্ট্রাকচার) পাই এবং কে-লাইন অ্যারে অতিক্রম করি। আপনি উদাহরণ হিসাবে ট্রাভার্স করার জন্য একটি সহজ লুপ ব্যবহার করতে পারেন, অথবা আপনি অতিক্রম করার জন্য অন্যান্য পদ্ধতি ব্যবহার করতে পারেন।
অঙ্কন অপারেশনগুলি থেকে করা উচিতc.begin(bar)ফাংশন শুরু হয়,c.close()ফাংশন শেষ।begin、closeফাংশনগুলি চার্ট অবজেক্টের সমস্ত পদ্ধতি c. এর পরে, সর্বাধিক ব্যবহৃত অঙ্কন ফাংশন ব্যবহার করুনplotপ্রতিটি বারে ভলিউম বক্ররেখা আঁকুন।
আরও জটিল উদাহরণ
ধরুন আমরা বলিঞ্জার ইন্ডিকেটর দিয়ে একটি চার্ট ডিজাইন করতে চাই। ওহ হ্যাঁ! এটি প্রতিটি বারের জন্য একটি ট্রেডিং ভলিউম চার্ট সহ আসে, যা এইভাবে ডিজাইন করা যেতে পারে:
            javascript

            /*backtest
start: 2022-03-21 09:00:00
end: 2022-06-21 15:00:00
period: 1d
basePeriod: 1h
exchanges: [{"eid":"Binance","currency":"BTC_USDT"}]
*/

function main() {
    var c = KLineChart()

    // 策略主循环
    while(true) {
        // 轮询间隔
        Sleep(500)

        // 获取K线数据
        let bars = exchange.GetRecords()
        if (!bars || bars.length <= 20) {
            continue
        }

        // 计算布林指标
        var boll = TA.BOLL(bars)

        bars.forEach(function(bar, index) {
            c.begin(bar)
            // 画图操作
            c.plot(boll[0][index], "Boll_Up", {overlay: true})     // 画在图表主图
            c.plot(boll[1][index], "Boll_Mid", {overlay: true})    // 画在图表主图
            c.plot(boll[2][index], "Boll_Down", {overlay: true})   // 画在图表主图
            c.plot(bar.Volume, "volume")                           // 画在图表副图
            c.close()
        })

        // 策略交易逻辑
        // ...
        // ..
    }
}
আপনি কোডটিতে দেখতে পারেন যে FMZ প্ল্যাটফর্মে আমাদের ব্যাকটেস্ট কনফিগারেশন তথ্য হল:
            /*backtest
start: 2022-03-21 09:00:00
end: 2022-06-21 15:00:00
period: 1d
basePeriod: 1h
exchanges: [{"eid":"Binance","currency":"BTC_USDT"}]
*/
এই কনফিগারেশনটি Binance স্পট এক্সচেঞ্জ অবজেক্ট ব্যবহার করে ব্যাকটেস্ট করা হয়। ব্যাকটেস্টের ফলাফল চিত্রে দেখানো হয়েছে:
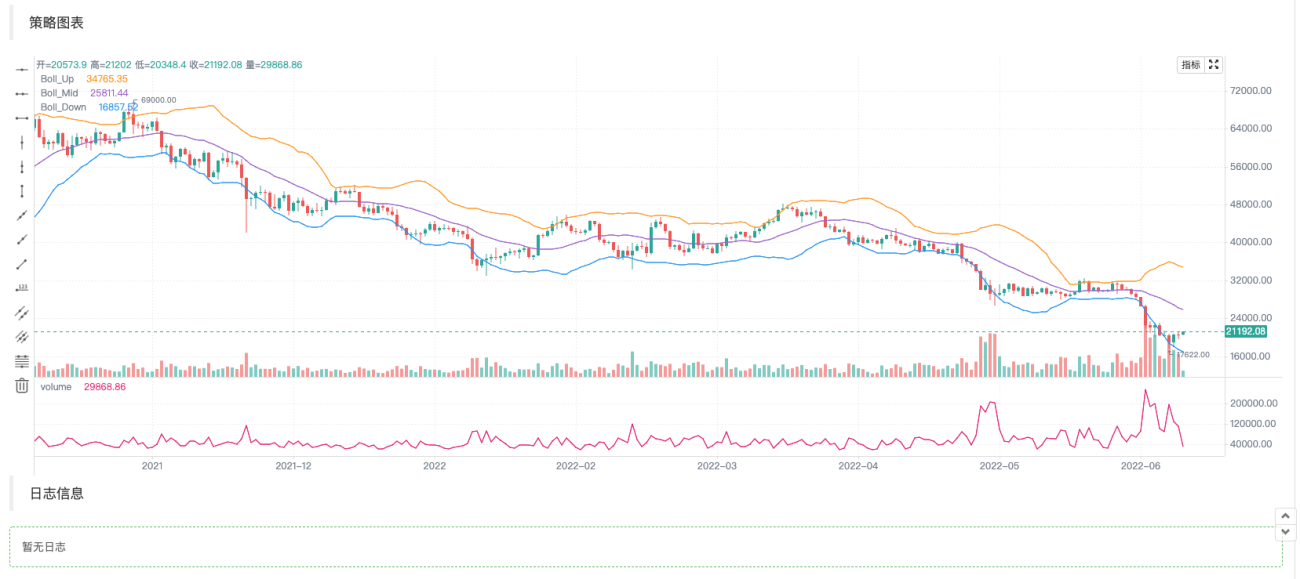
এটি দেখা যায় যে আমরা পাইনের অঙ্কন পদ্ধতি ব্যবহার করি, যা জাভাস্ক্রিপ্ট ভাষায় অঙ্কন কোডটিকে ব্যাপকভাবে সরল করে।
তথ্য লিখুন যেমন সূচক এবং গ্রাফ আঁকা
প্ল্যাটফর্ম স্ট্র্যাটেজি স্কোয়ারের কৌশল উদাহরণ এবং API নথিতে কে-লাইন ডেটা প্রাপ্ত করা এবং সূচকগুলি গণনা করা খুব সাধারণ, এবং সেগুলিও খুব সহজ।
            javascript

                    // 获取K线数据
        let bars = exchange.GetRecords()
        if (!bars || bars.length <= 20) {
            // 如果获取K线失败,即!bar为真则执行continue,忽略之后的代码,重新执行循环
            // 如果bars.length小于等于20,即K线BAR(柱)数量小于20,无法计算指标,也执行continue
            continue
        }

        // 计算布林指标
        var boll = TA.BOLL(bars)
বলিঙ্গার ইন্ডিকেটর ক্যালকুলেশন ফাংশন TA.BOLL, যদি বলিঙ্গার ইন্ডিকেটর প্যারামিটার নির্দিষ্ট করা না থাকে, ডিফল্ট প্যারামিটার ব্যবহার করা হবে।BOLL(20, 2). বলিঙ্গার নির্দেশকের তিনটি লাইন আছে, তাই TA.BOLL ফাংশন দ্বারা প্রত্যাবর্তিত ডেটা একটি দ্বি-মাত্রিক অ্যারে। বোল[0]、boll[1]、boll[2] বোল অ্যারের তিনটি উপাদান তাদের প্রত্যেকটি একটি লাইনকে উপস্থাপন করে এবং একটি অ্যারে।
- boll[0]: বলিঙ্গার ব্যান্ডস অনলাইন
- boll[1]: বলিঙ্গার ব্যান্ডস মিডল লাইন
- boll[2]: বলিঙ্গার ব্যান্ড অফলাইন
তারপর আমরা দেখব কিভাবে কে-লাইন ডেটার ভলিউম আঁকতে হয়, অর্থাৎ ট্রেডিং ভলিউম এবং চার্টে গণনা করা বলিঙ্গার সূচক ডেটা।
আমরা বার দ্বারা কে-লাইন ডেটা বার আঁকি, তাই আমাদের পুরো কে-লাইন অ্যারেটি অতিক্রম করতে হবে, অর্থাৎ কোডের বার অ্যারেটি অতিক্রম করতে হবে। এখানে ব্যবহার করা হয়forEachএকটি ফর লুপ ব্যবহার করে মেথড ট্রাভার্সালও ট্রাভার্স করা যায়।
            javascript

                    bars.forEach(function(bar, index) {
            c.begin(bar)
            // 画图操作
            c.plot(boll[0][index], "Boll_Up", {overlay: true})     // {overlay: true}参数控制,画在图表主图
            c.plot(boll[1][index], "Boll_Mid", {overlay: true})    // 画在图表主图
            c.plot(boll[2][index], "Boll_Down", {overlay: true})   // 画在图表主图
            c.plot(bar.Volume, "volume")                           // 画在图表副图
            c.close()
        })
এটি লক্ষ করা উচিত যে আপনি যখনই একটি বারে একটি চার্ট অঙ্কন অপারেশন শুরু করবেন, আপনাকে অবশ্যই প্রথমেই করতে হবেc.begin(bar)ফাংশন কল,beginফাংশনটি আমাদের চার্ট অবজেক্টের একটি পদ্ধতি c. অঙ্কন অপারেশন শেষ হলে, আপনাকে কল করতে হবেc.close(). বিদ্যমানbeginফাংশন যোগফলcloseফাংশনগুলির মধ্যে অঙ্কন ফাংশনগুলিকে আমরা বলি যেগুলি পাইন ভাষার অঙ্কন পদ্ধতির অনুরূপ। সমর্থন:barcolor bgcolor plot fill hline plotarrow plotshape plotchar plotcandle signal, আপনি লাইন, তীর, চিহ্নিত তথ্য, ইত্যাদি আঁকতে পারেন। এই ফাংশনগুলির প্যারামিটারগুলি পাইন ভাষার সাথে সামঞ্জস্যপূর্ণ এবং অঙ্কন ফাংশনগুলিও সামঞ্জস্যপূর্ণ।
ট্রেডিং সিগন্যাল তীর, চিহ্ন, অনুভূমিক রেখা এবং অন্যান্য অঙ্কন যোগ করুন
উপরের বলিঙ্গার নির্দেশক অঙ্কন উদাহরণে কিছু ট্রেডিং সংকেত তীর, মার্কার এবং অনুভূমিক রেখা যোগ করুন।
            javascript

            /*backtest
start: 2022-03-21 09:00:00
end: 2022-06-21 15:00:00
period: 1d
basePeriod: 1h
exchanges: [{"eid":"Binance","currency":"BTC_USDT"}]
*/

function main() {
    var c = KLineChart()

    // 策略主循环
    while(true) {
        // 轮询间隔
        Sleep(500)

        // 获取K线数据
        let bars = exchange.GetRecords()
        if (!bars || bars.length <= 20) {
            continue
        }

        // 计算布林指标
        var boll = TA.BOLL(bars)

        bars.forEach(function(bar, index) {
            c.begin(bar)
            // 画图操作
            c.plot(boll[0][index], "Boll_Up", {overlay: true})     // 画在图表主图
            c.plot(boll[1][index], "Boll_Mid", {overlay: true})    // 画在图表主图
            c.plot(boll[2][index], "Boll_Down", {overlay: true})   // 画在图表主图
            c.plot(bar.Volume, "volume")                           // 画在图表副图

            c.hline(bar.Open, {overlay: true})                                         // 水平线
            c.plotarrow(bar.Close - bar.Open, {overlay: true})                         // 箭头
            c.plotshape(bar.Close - bar.Open > 0, {style: 'square', overlay: true})    // 画方块标记
            c.plotchar(bar.Close - bar.Open < 0, {char: '❄', size: "20px", overlay: true})           // 画出字符❄
            if (boll[0][index] && bar.Close > boll[0][index]) {
                c.signal("long", bar.Close, 1.5)
            } else if (boll[2][index] && bar.Close < boll[2][index]) {
                c.signal("closelong", bar.Close, 1.5)
            }

            c.close()
        })

        // 策略交易逻辑
        // ...
        // ..
    }
}
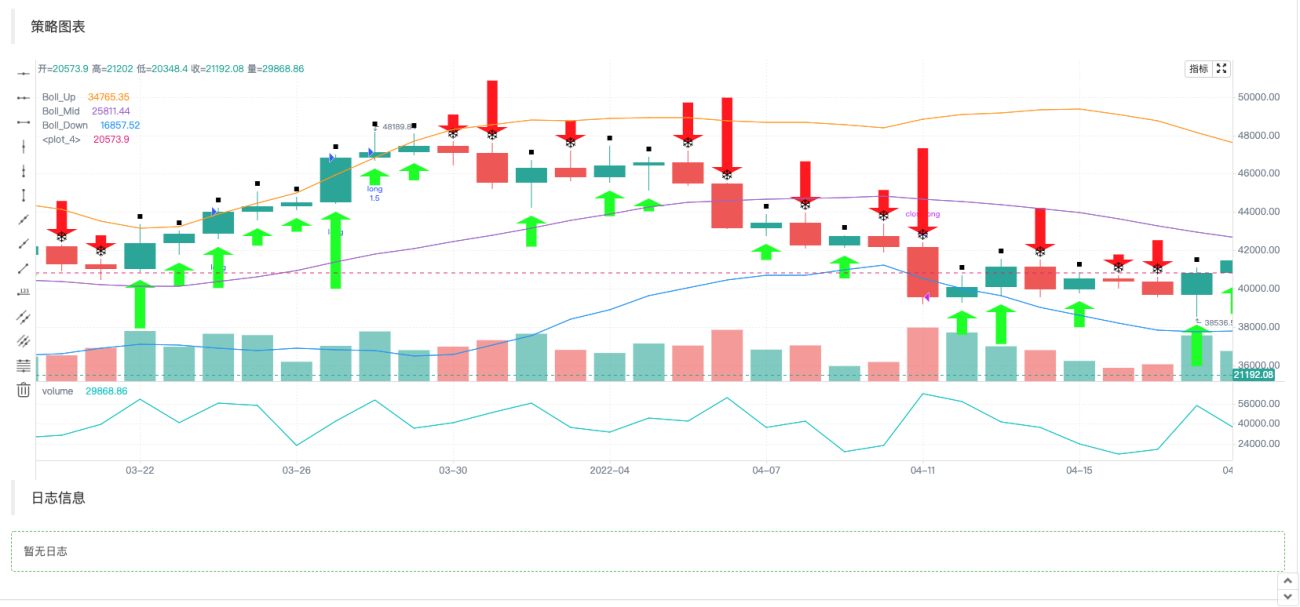
যেহেতু পাইন ভাষা কৌশল অর্ডার অপারেশন স্বয়ংক্রিয়ভাবে চার্টে সংকেত চিহ্নিত করবে, তাইKLineChartফাংশন দ্বারা তৈরি চার্ট অবজেক্ট ক্রয়-বিক্রয় সংকেত মার্কার আঁকার জন্য একটি ফাংশন প্রসারিত করে:c.signal。
চার্ট কনফিগারেশন অবজেক্ট
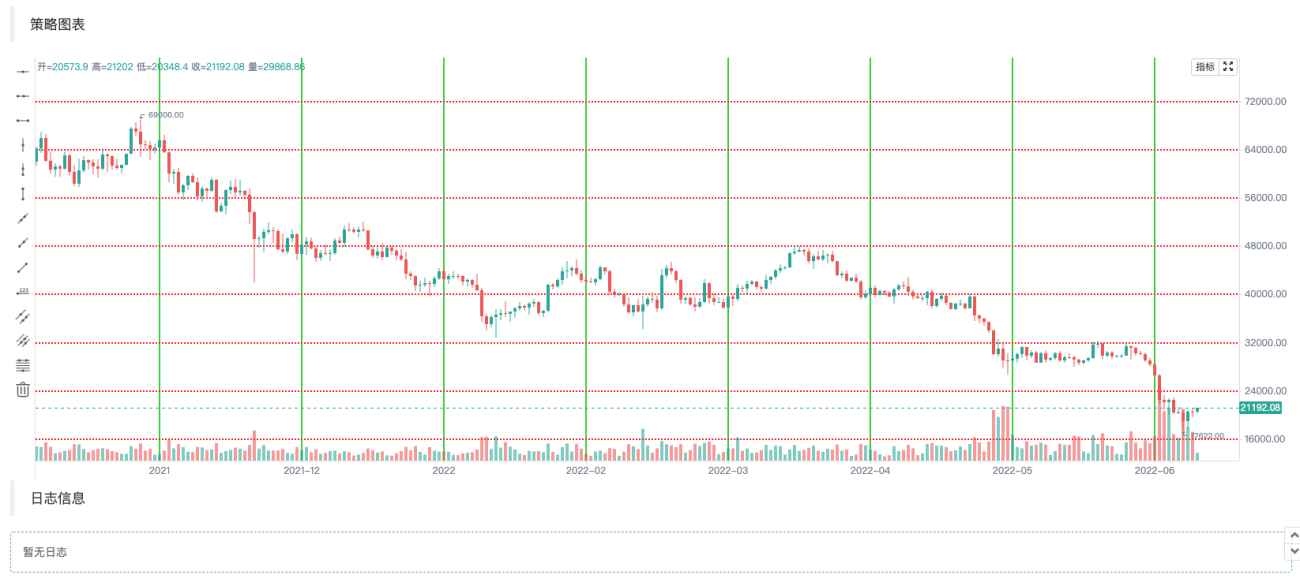
আপনি চার্ট শৈলী কনফিগার করার জন্য একটি কাঠামো ঘোষণা করতে পারেন, উদাহরণস্বরূপ, নিম্নলিখিত চার্টসিএফজি ভেরিয়েবল একটি গ্রিড লাইনের কনফিগারেশন তথ্য উপস্থাপন করে।
            javascript

                var chartCfg = {
        grid: {
            show: true,
            // 网格水平线
            horizontal: {
                show: true,
                size: 2,
                color: '#FF0000',    // 水平网格线的颜色
                // 'solid'|'dash'
                style: 'dash',       // 线的类型
                dashValue: [2, 2]
            },
   	        // 网格垂直线
            vertical: {
                show: true,
                size: 2,
                color: '#32CD32',
                // 'solid'|'dash'
                style: 'solid',
                dashValue: [2, 2]
            }
        },
    }
চার্ট কনফিগারেশন অবজেক্ট হল একটি ডাটা স্ট্রাকচার যা চার্টের কিছু বৈশিষ্ট্য, চেহারা ইত্যাদি সেট করে, উদাহরণে ব্যবহৃত কনফিগারেশন হল একটি গ্রিড লাইন স্টাইল কনফিগারেশন। অনেক অপশন আছে যা কনফিগার এবং পরিবর্তন করা যেতে পারে, যেমন X-অক্ষ এবং Y-অক্ষ সম্পর্কিত সেটিংস, কার্সার লাইন সেটিংস, প্রম্পট তথ্য সেটিংস, প্রযুক্তিগত নির্দেশক শৈলী সেটিংস, কে-লাইন বার শৈলী সেটিংস ইত্যাদি।
অবশ্য এসবের সাথে পরিচিত না হলে ফোন করার আগেKLineChartএকটি চার্ট অবজেক্ট তৈরি করার সময় ফাংশনটি চার্ট কনফিগারেশন অবজেক্টে পাস করার প্রয়োজন নেই। তারপর তৈরি করা চার্টটি ডিফল্ট শৈলী। FMZ প্ল্যাটফর্মের API ফাংশন ব্যবহার করাKLineChartফাংশন চার্ট অবজেক্ট তৈরি করে:
            javascript

            var c = KLineChart(chartCfg)
গ্রিড লাইন আঁকার জন্য টেস্ট কোড:
            javascript

            /*backtest
start: 2022-03-21 09:00:00
end: 2022-06-21 15:00:00
period: 1d
basePeriod: 1h
exchanges: [{"eid":"Binance","currency":"BTC_USDT"}]
*/

function main() {
    var chartCfg = {
        grid: {
            show: true,
            // 网格水平线
            horizontal: {
                show: true,
                size: 2,
                color: '#FF0000',
                // 'solid'|'dash'
                style: 'dash',
                dashValue: [2, 2]
            },
   	        // 网格垂直线
            vertical: {
                show: true,
                size: 2,
                color: '#32CD32',
                // 'solid'|'dash'
                style: 'solid',
                dashValue: [2, 2]
            }
        },
    }

    var c = KLineChart(chartCfg)

    // 策略主循环
    while(true) {
        // 轮询间隔
        Sleep(500)

        // 获取K线数据
        var bars = _C(exchange.GetRecords)
        bars.forEach(function(bar, index) {
            c.begin(bar)
            c.close()
        })

        // 策略交易逻辑
        // ...
        // ..
    }
}
চার্ট কনফিগারেশন শৈলী উদাহরণ
চার্ট কনফিগারেশন শৈলী সেটিংস উল্লেখ করতে ব্যবহার করা যেতে পারে।
javascript
{
// 网格线
grid: {
show: true,
// 网格水平线
horizontal: {
show: true,
size: 1,
color: '#393939',
// 'solid'|'dash'
style: 'dash',
dashValue: [2, 2]
},
// 网格垂直线
vertical: {
show: false,
size: 1,
color: '#393939',
// 'solid'|'dash'
style: 'dash',
dashValue: [2, 2]
}
},
// 蜡烛图
candle: {
// 蜡烛图上下间距,大于1为绝对值,大于0小余1则为比例
margin: {
top: 0.2,
bottom: 0.1
},
// 蜡烛图类型 'candle_solid'|'candle_stroke'|'candle_up_stroke'|'candle_down_stroke'|'ohlc'|'area'
type: 'candle_solid',
// 蜡烛柱
bar: {
upColor: '#26A69A',
downColor: '#EF5350',
noChangeColor: '#888888'
},
// 面积图
area: {
lineSize: 2,
lineColor: '#2196F3',
value: 'close',
backgroundColor: [{
offset: 0,
color: 'rgba(33, 150, 243, 0.01)'
}, {
offset: 1,
color: 'rgba(33, 150, 243, 0.2)'
}]
},
priceMark: {
show: true,
// 最高价标记
high: {
show: true,
color: '#D9D9D9',
textMargin: 5,
textSize: 10,
textFamily: 'Helvetica Neue',
textWeight: 'normal'
},
// 最低价标记
low: {
show: true,
color: '#D9D9D9',
textMargin: 5,
textSize: 10,
textFamily: 'Helvetica Neue',
textWeight: 'normal',
},
// 最新价标记
last: {
show: true,
upColor: '#26A69A',
downColor: '#EF5350',
noChangeColor: '#888888',
line: {
show: true,
// 'solid'|'dash'
style: 'dash',
dashValue: [4, 4],
size: 1
},
text: {
show: true,
size: 12,
paddingLeft: 2,
paddingTop: 2,
paddingRight: 2,
paddingBottom: 2,
color: '#FFFFFF',
family: 'Helvetica Neue',
weight: 'normal',
borderRadius: 2
}
}
},
// 提示
tooltip: {
// 'always' | 'follow_cross' | 'none'
showRule: 'always',
// 'standard' | 'rect'
showType: 'standard',
labels: ['时间', '开', '收', '高', '低', '成交量'],
values: null,
defaultValue: 'n/a',
rect: {
paddingLeft: 0,
paddingRight: 0,
paddingTop: 0,
paddingBottom: 6,
offsetLeft: 8,
offsetTop: 8,
offsetRight: 8,
borderRadius: 4,
borderSize: 1,
borderColor: '#3f4254',
backgroundColor: 'rgba(17, 17, 17, .3)'
},
text: {
size: 12,
family: 'Helvetica Neue',
weight: 'normal',
color: '#D9D9D9',
marginLeft: 8,
marginTop: 6,
marginRight: 8,
marginBottom: 0
}
}
},
// 技术指标
technicalIndicator: {
margin: {
top: 0.2,
bottom: 0.1
},
bar: {
upColor: '#26A69A',
downColor: '#EF5350',
noChangeColor: '#888888'
},
line: {
size: 1,
colors: ['#FF9600', '#9D65C9', '#2196F3', '#E11D74', '#01C5C4']
},
circle: {
upColor: '#26A69A',
downColor: '#EF5350',
noChangeColor: '#888888'
},
// 最新值标记
lastValueMark: {
show: false,
text: {
show: false,
color: '#ffffff',
size: 12,
family: 'Helvetica Neue',
weight: 'normal',
paddingLeft: 3,
paddingTop: 2,
paddingRight: 3,
paddingBottom: 2,
borderRadius: 2
}
},
// 提示
tooltip: {
// 'always' | 'follow_cross' | 'none'
showRule: 'always',
// 'standard' | 'rect'
showType: 'standard',
showName: true,
showParams: true,
defaultValue: 'n/a',
text: {
size: 12,
family: 'Helvetica Neue',
weight: 'normal',
color: '#D9D9D9',
marginTop: 6,
marginRight: 8,
marginBottom: 0,
marginLeft: 8
}
}
},
// x轴
xAxis: {
show: true,
height: null,
// x轴线
axisLine: {
show: true,
color: '#888888',
size: 1
},
// x轴分割文字
tickText: {
show: true,
color: '#D9D9D9',
family: 'Helvetica Neue',
weight: 'normal',
size: 12,
paddingTop: 3,
paddingBottom: 6
},
// x轴分割线
tickLine: {
show: true,
size: 1,
length: 3,
color: '#888888'
}
},
// y轴
yAxis: {
show: true,
width: null,
// 'left' | 'right'
position: 'right',
// 'normal' | 'percentage' | 'log'
type: 'normal',
inside: false,
reverse: false,
// y轴线
axisLine: {
show: true,
color: '#888888',
size: 1
},
// y轴分割文字
tickText: {
show: true,
color: '#D9D9D9',
family: 'Helvetica Neue',
weight: 'normal',
size: 12,
paddingLeft: 3,
paddingRight: 6
},
// y轴分割线
tickLine: {
show: true,
size: 1,
length: 3,
color: '#888888'
}
},
// 图表之间的分割线
separator: {
size: 1,
color: '#888888',
fill: true,
activeBackgroundColor: 'rgba(230, 230, 230, .15)'
},
// 十字光标
crosshair: {
show: true,
// 十字光标水平线及文字
horizontal: {
show: true,
line: {
show: true,
// 'solid'|'dash'
style: 'dash',
dashValue: [4, 2],
size: 1,
color: '#888888'
},
text: {
show: true,
color: '#D9D9D9',
size: 12,
family: 'Helvetica Neue',
weight: 'normal',
paddingLeft: 2,
paddingRight: 2,
paddingTop: 2,
paddingBottom: 2,
borderSize: 1,
borderColor: '#505050',
borderRadius: 2,
backgroundColor: '#505050'
}
},
// 十字光标垂直线及文字
vertical: {
show: true,
line: {
show: true,
// 'solid'|'dash'
style: 'dash',
dashValue: [4, 2],
size: 1,
color: '#888888'
},
text: {
show: true,
color: '#D9D9D9',
size: 12,
family: 'Helvetica Neue',
weight: 'normal',
paddingLeft: 2,
paddingRight: 2,
paddingTop: 2,
paddingBottom: 2,
borderSize: 1,
borderColor: '#505050',
borderRadius: 2,
backgroundColor: '#505050'
}
}
},
// 图形
shape: {
point: {
backgroundColor: '#2196F3',
borderColor: '#2196F3',
borderSize: 1,
radius: 4,
activeBackgroundColor: '#2196F3',
activeBorderColor: '#2196F3',
activeBorderSize: 1,
activeRadius: 6
},
line: {
// 'solid'|'dash'
style: 'solid'
color: '#2196F3',
size: 1,
dashValue: [2, 2]
},
polygon: {
// 'stroke'|'fill'
style: 'stroke',
stroke: {
// 'solid'|'dash'
style: 'solid',
size: 1,
color: '#2196F3',
dashValue: [2, 2]
},
fill: {
color: 'rgba(33, 150, 243, 0.1)'
}
},
arc: {
// 'stroke'|'fill'
style: 'stroke',
stroke: {
// 'solid'|'dash'
style: 'solid',
size: 1,
color: '#2196F3',
dashValue: [2, 2]
},
fill: {
color: '#2196F3'
}
},
text: {
style: 'fill',
color: '#2196F3',
size: 12,
family: 'Helvetica Neue',
weight: 'normal',
offset: [0, 0]
}
},
annotation: {
// 'top' | 'bottom' | 'point'
position: 'top',
offset: [20, 0]
symbol: {
// 'diamond' | 'circle' | 'rect' | 'triangle' | 'custom' | 'none'
type: 'diamond',
size: 8,
color: '#2196F3',
activeSize: 10,
activeColor: '#FF9600'
}
},
tag: {
// 'top' | 'bottom' | 'point'
position: 'point',
offset: 0,
line: {
show: true,
style: LineStyle.DASH,
dashValue: [4, 2],
size: 1,
color: '#2196F3'
},
text: {
color: '#FFFFFF',
backgroundColor: '#2196F3',
size: 12,
family: 'Helvetica Neue',
weight: 'normal',
paddingLeft: 2,
paddingRight: 2,
paddingTop: 2,
paddingBottom: 2,
borderRadius: 2,
borderSize: 1,
borderColor: '#2196F3'
},
mark: {
offset: 0,
color: '#FFFFFF',
backgroundColor: '#2196F3',
size: 12,
family: 'Helvetica Neue',
weight: 'normal',
paddingLeft: 2,
paddingRight: 2,
paddingTop: 2,
paddingBottom: 2,
borderRadius: 2,
borderSize: 1,
borderColor: '#2196F3'
}
}
}
এটি কি কৌশল অঙ্কন এবং নকশাকে সহজ করে তোলে না?

梦总,感谢分享!
我请教一个场景,不知道现阶段使用KLineChart能否实现。 具体场景说明:
1、策略是多品种交易 ;
2、加载策略的时候,默认指定的品种进行图表的绘制,包括K线、指标、交易信号等等;
3、通过筛选框,选择其他的交易品种,获取历史K线绘制图表,直到当前时间对应的K线。
目的在于通过图表直接观察各个交易品种是否是合理开平仓的,交易是否正常。

1、策略是多品种交易 ;
对于多图表,KLineChart 函数不支持,可以使用画图接口Chart函数,可以参考多图表画线类库的设计。
2、加载策略的时候,默认指定的品种进行图表的绘制,包括K线、指标、交易信号等等;
单图表可以实现。
3、通过筛选框,选择其他的交易品种,获取历史K线绘制图表,直到当前时间对应的K线。
单图表可以实现,可以具体编写代码查询历史K线数据然后填充画图.
如果是多品种策略,建议使用Chart函数画图。KLineChart 函数目前只能单图表画图。
- 1