একটি ট্রেন্ড-অনুসরণকারী পরিমাণগত ট্রেডিং কৌশল যা একটি ঐতিহাসিক উচ্চ সাফল্যের সাথে একটি মাসিক চলমান গড় ফিল্টারকে একত্রিত করে।

ওভারভিউ
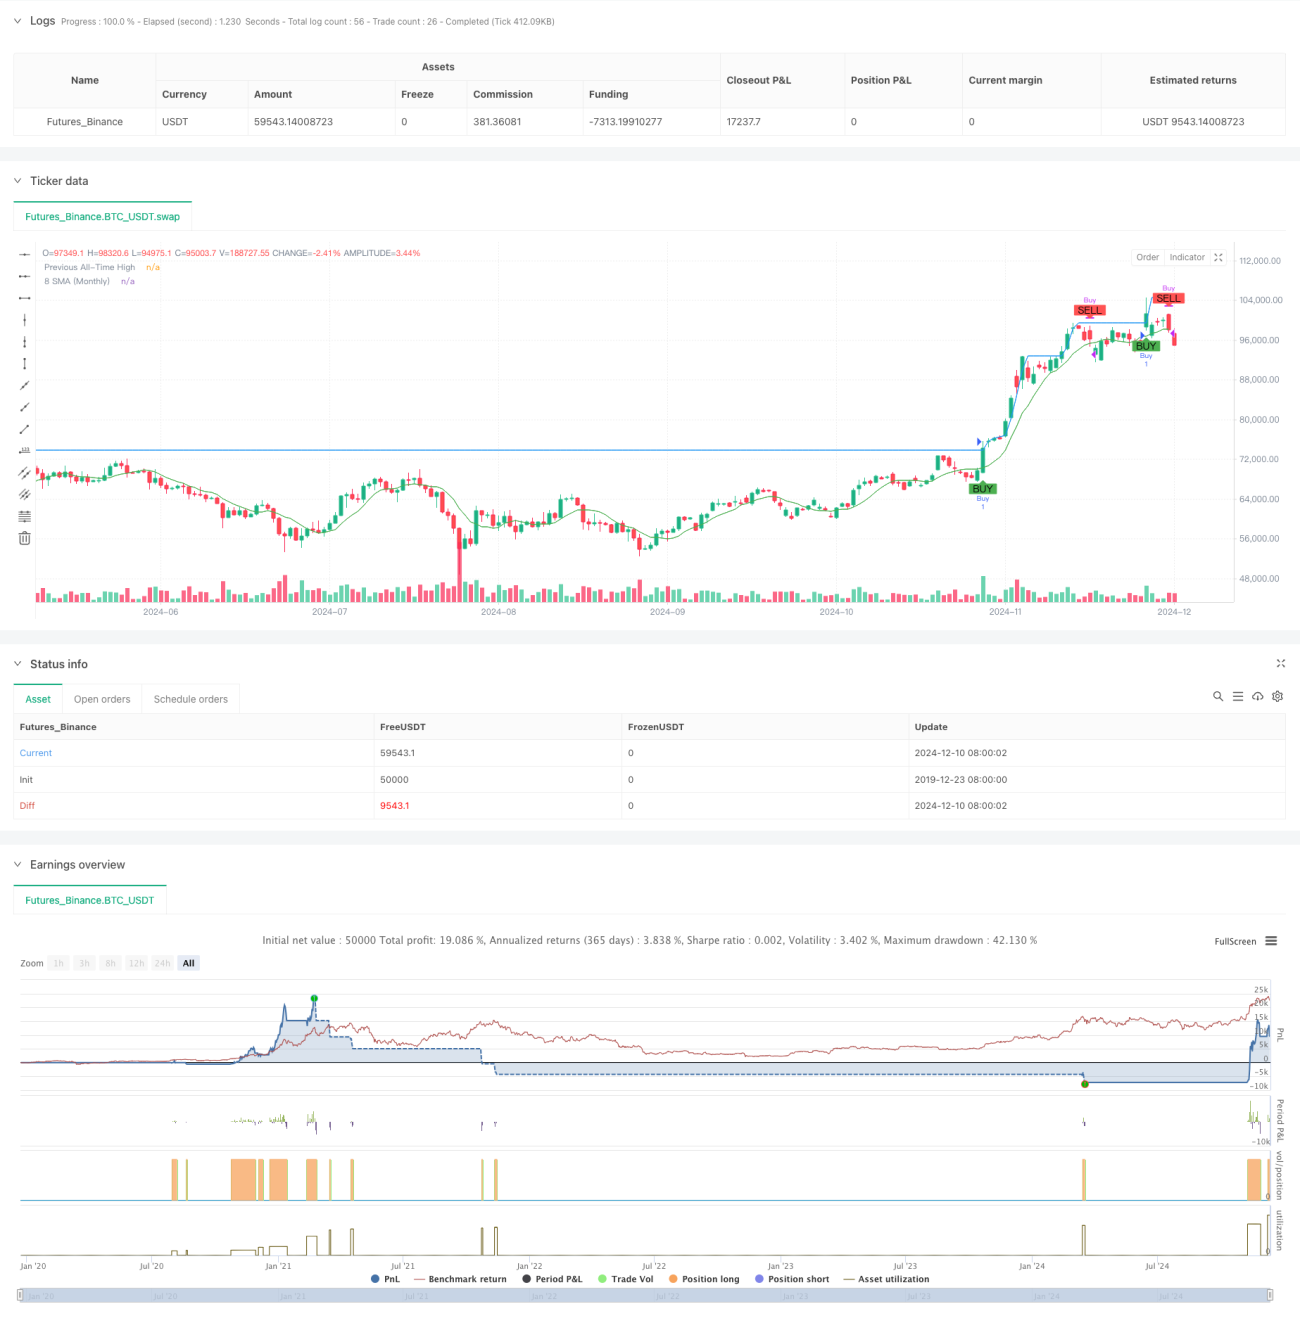
এই কৌশলটি একটি ট্রেন্ড ট্র্যাকিং কৌশল যা ঐতিহাসিক নতুন উচ্চতা এবং মুন লাইন গড় ফিল্টারিংয়ের উপর ভিত্তি করে। এটি মূল্যের পূর্ববর্তী ঐতিহাসিক সর্বোচ্চ পয়েন্টটি অতিক্রম করে কিনা তা পর্যবেক্ষণ করে একটি কেনার সংকেত খুঁজতে, এবং মুন লাইন 8 চক্রের সহজ মুভিং এভারেজ ((8 এসএমএ) ব্যবহার করে একটি বিক্রয় ফিল্টারিং শর্ত হিসাবে, যাতে ভুয়া ব্রেকিংয়ের ঝুঁকি কমাতে পারে। এই কৌশলটির নকশা ধারণাটি "ট্রেন্ড ক্রমাগততা" বাজার বৈশিষ্ট্য অনুসারে, বিশেষত শক্তিশালী উত্থান প্রবণতাগুলির মধ্যে বড় আকারের ট্রেন্ডিং ক্যাপচার করার জন্য উপযুক্ত।
কৌশল নীতি
কৌশলটির মূল যুক্তি দুটি গুরুত্বপূর্ণ অংশ নিয়ে গঠিতঃ
- ক্রয় সংকেত: যখন সর্বশেষ বন্ধের মূল্য পূর্ববর্তী সময়ের সর্বোচ্চ ঐতিহাসিক পয়েন্ট অতিক্রম করে ((বর্তমান K-লাইন সর্বোচ্চ মূল্য অন্তর্ভুক্ত না করে) তখন সিস্টেমটি একটি ক্রয় সংকেত উৎপন্ন করে। এই শর্তটি নিশ্চিত করে যে কেবলমাত্র একটি স্পষ্ট উত্থান প্রবণতা রয়েছে।
- বিক্রয় সংকেতঃ যখন চন্দ্রের শেষের দাম 8 পিরিয়ডের সরল চলমান গড়ের নীচে চলে যায়, তখন সিস্টেমটি বিক্রয় সংকেতকে ট্রিগার করে। এই শর্তটি সময়মতো ক্ষতি বন্ধ করতে সহায়তা করে এবং প্রবণতা বিপরীত হওয়ার ফলে আরও বেশি ক্ষতি হতে পারে।
কৌশলটি একই অবস্থায় বারবার সংকেত তৈরি করা এড়াতে, কৌশলটির স্থায়িত্ব বাড়ানোর জন্য একটি সংকেত অবস্থা ট্র্যাকিং প্রক্রিয়াও ডিজাইন করেছে।
কৌশলগত সুবিধা
- প্রবণতা ধরার ক্ষমতাঃ ঐতিহাসিক উচ্চতা অতিক্রম করে, শক্তিশালী উচ্চতর প্রবণতা কার্যকরভাবে ধরা যায়।
- ঝুঁকি নিয়ন্ত্রণ উন্নতঃ ফিল্টারিং শর্ত হিসাবে চাঁদের রেখার সমতল রেখার সমন্বয়ে, ভুয়া ব্রেকআউটগুলিকে কার্যকরভাবে ফিল্টার করা যায়।
- সিগন্যাল স্থিতিশীলতাঃ সিগন্যালের অবস্থা ট্র্যাক করতে lastSignal ভেরিয়েবল ব্যবহার করে, যাতে সিগন্যালের পুনরাবৃত্তি না হয়।
- ভাল ভিজ্যুয়ালাইজেশনঃ কৌশলটি একটি পরিষ্কার গ্রাফিকাল ইন্টারফেস প্রদান করে, যার মধ্যে রয়েছে ঐতিহাসিক উচ্চতম লাইন, গড় লাইন এবং ক্রয়-বিক্রয় সংকেত চিহ্নিতকারী।
- অভিযোজনযোগ্যতাঃ কৌশলটি বিভিন্ন সময়কাল এবং জাতের জন্য প্রয়োগ করা যেতে পারে।
কৌশলগত ঝুঁকি
- পিছিয়ে পড়ার ঝুঁকিঃ নতুন রেকর্ডের উচ্চতা অতিক্রম করার সংকেতটি কিছুটা পিছিয়ে রয়েছে এবং এটি সেরা সময়টি মিস করতে পারে।
- ভুয়া ব্রেকিংয়ের ঝুঁকিঃ চাঁদনির মধ্যম লাইন ফিল্টার থাকা সত্ত্বেও, বাজারের অস্থিরতার মধ্যে ভুয়া ব্রেকিংয়ের সম্ভাবনা রয়েছে।
- প্রত্যাহারের ঝুঁকিঃ প্রবণতা পরিবর্তনের সময়, কৌশলটি একটি বড় প্রত্যাহারের সম্মুখীন হতে পারে।
- তহবিল ব্যবস্থাপনার ঝুঁকিঃ কৌশলটিতে পজিশন ব্যবস্থাপনার ব্যবস্থা নেই, অতিরিক্ত তহবিল ব্যবস্থাপনার নিয়ম প্রয়োজন।
কৌশল অপ্টিমাইজেশনের দিকনির্দেশনা
- ইনপুট ভলিউম নিশ্চিতকরণঃ সিগন্যালের নির্ভরযোগ্যতা বাড়ানোর জন্য একটি ব্রেকথ্রু নিশ্চিতকরণ শর্ত হিসাবে একটি ট্রানজিট ভলিউম সূচক যুক্ত করা যেতে পারে।
- ক্ষতি বন্ধ করার পদ্ধতি উন্নত করুনঃ আপনি আরও নমনীয় ক্ষতির নিয়মগুলি ডিজাইন করতে পারেন, যেমন ট্র্যাকিং ক্ষতি বা ওঠানামা হারের ক্ষতি।
- পজিশন ম্যানেজমেন্ট যোগ করুনঃ পজিশনের আকার বাজারের ওঠানামা এবং প্রবণতা শক্তির উপর ভিত্তি করে গতিশীলভাবে সামঞ্জস্য করুন।
- অপ্টিমাইজড সংকেত ফিল্টারিংঃ প্রবণতা শক্তির সূচক যেমন ADX যোগ করা যেতে পারে, আরও দুর্বলতা সংকেত ফিল্টার করতে।
- সময় ফিল্টার যুক্ত করুনঃ সময়কাল ফিল্টার যুক্ত করুন যাতে অপ্রয়োজনীয় সময়ে লেনদেন করা যায় না।
সারসংক্ষেপ
এটি একটি যুক্তিসঙ্গত, যুক্তিসঙ্গত এবং স্পষ্ট প্রবণতা ট্র্যাকিং কৌশল। ঐতিহাসিক নতুন উচ্চতা এবং চাঁদ লাইন গড়ের সংমিশ্রণ ব্যবহারের মাধ্যমে প্রবণতা সম্পর্কে কার্যকর ধারণা নিশ্চিত করা হয় এবং ঝুঁকির যুক্তিসঙ্গত নিয়ন্ত্রণ বাস্তবায়িত হয়। যদিও কিছু পিছিয়ে পড়া এবং মিথ্যা ব্রেকিংয়ের ঝুঁকি রয়েছে, তবে প্রস্তাবিত অপ্টিমাইজড দিকনির্দেশের মাধ্যমে কৌশলটির সামগ্রিক কর্মক্ষমতা আরও উন্নত হওয়ার সম্ভাবনা রয়েছে। এই কৌশলটি স্পষ্ট প্রবণতাযুক্ত বাজারের পরিবেশে বিশেষভাবে উপযুক্ত এবং এটি মাঝারি এবং দীর্ঘমেয়াদী বিনিয়োগের জন্য একটি গুরুত্বপূর্ণ রেফারেন্স সরঞ্জাম হিসাবে কাজ করতে পারে।
- 1