
ওভারভিউ
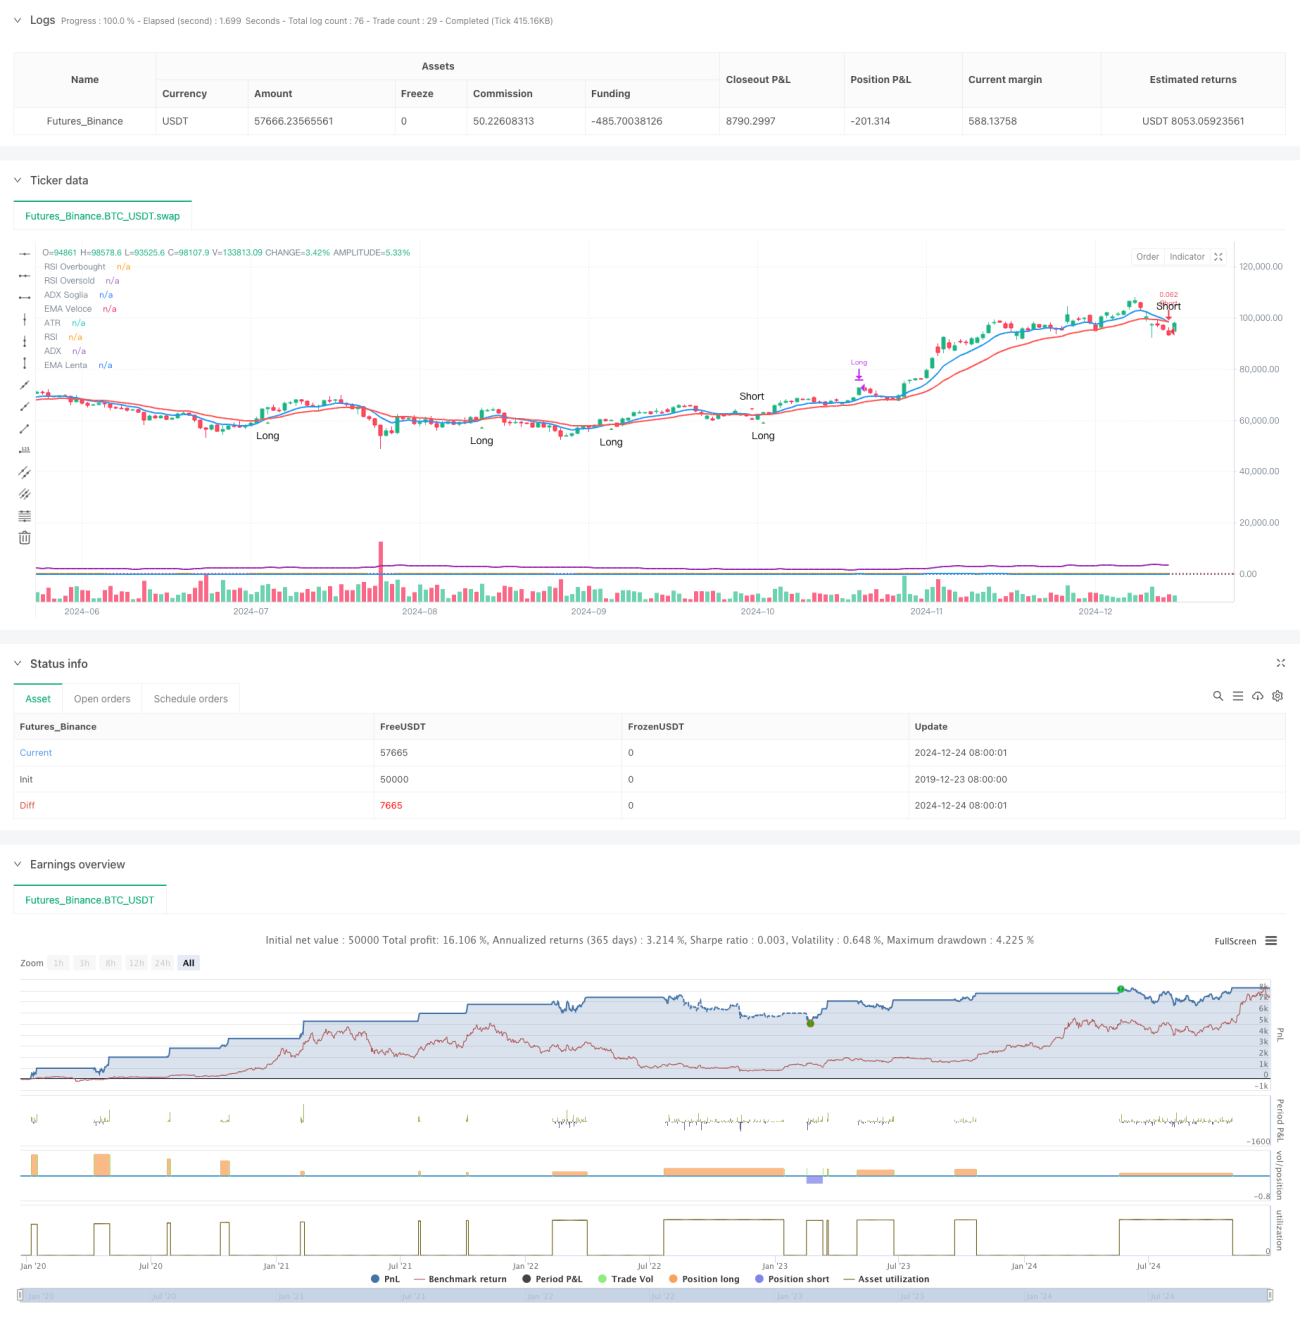
এই কৌশলটি 15 মিনিটের সময় ফ্রেমের উপর ভিত্তি করে একটি উচ্চ-ফ্রিকোয়েন্সি ট্রেডিং কৌশল। এই কৌশলটি একাধিক প্রযুক্তিগত সূচককে একত্রিত করে, যার মধ্যে রয়েছে এক্সপোনেনশিয়াল মুভিং এভারেজ (EMA), আপেক্ষিক শক্তি সূচক (RSI), গড় প্রবণতা সূচক (ADX), এবং গড় ট্রু রেঞ্জ (ATR), এর সমন্বয়ের মাধ্যমে ট্রেডিং সিগন্যাল অর্জন করতে। সূচকগুলি সঠিক ক্যাপচার এবং ঝুঁকির গতিশীল ব্যবস্থাপনা। কৌশলটি রিয়েল টাইমে বাজারের অবস্থা এবং ট্রেডিং সিগন্যাল নিরীক্ষণ করতে ব্যবসায়ীদের সুবিধার্থে একটি স্পষ্ট ভিজ্যুয়াল ডিজাইন গ্রহণ করে।
কৌশল নীতি
কৌশলটির মূল যুক্তিটি ট্রেডিং সংকেত তৈরি করার জন্য দ্রুত EMA (9 পিরিয়ড) এবং ধীর EMA (21 পিরিয়ড) এর সংযোগের উপর ভিত্তি করে। RSI (14 পিরিয়ড) বেশি বিক্রি হওয়া এলাকাগুলিকে ফিল্টার করতে ব্যবহৃত হয়, ADX (14 পিরিয়ড) ট্রেন্ড শক্তি নিশ্চিত করতে ব্যবহৃত হয় এবং ATR (14 পিরিয়ড) ব্যবহার করা হয় গতিশীলভাবে স্টপ লস এবং লাভের লক্ষ্য নির্ধারণ করতে। একাধিক প্রযুক্তিগত সূচকের সমন্বয় ট্রেডিং সিগন্যালের নির্ভরযোগ্যতা নিশ্চিত করে। প্রবেশের শর্তগুলির মধ্যে রয়েছে: দীর্ঘ - দ্রুত EMA ধীর EMA অতিক্রম করে এবং RSI 70 এর নিচে, এবং ADX সংক্ষিপ্ত - দ্রুত EMA নীচে ধীর EMA অতিক্রম করে এবং RSI 30 এর উপরে এবং ADX 20 এর উপরে হয়; . প্রস্থান ATR উপর ভিত্তি করে গতিশীল স্টপ লস এবং লাভ লক্ষ্য সেটিংস ব্যবহার করে।
কৌশলগত সুবিধা
- উচ্চ সংকেত নির্ভরযোগ্যতা: একাধিক প্রযুক্তিগত সূচকের ক্রস-ভ্যালিডেশন ট্রেডিং সংকেতের নির্ভুলতা উল্লেখযোগ্যভাবে উন্নত করে
- নমনীয় ঝুঁকি ব্যবস্থাপনা: ATR-এর উপর ভিত্তি করে ডায়নামিক স্টপ লস এবং লাভ টার্গেট সেটিংস, যা বাজারের অস্থিরতা অনুযায়ী স্বয়ংক্রিয়ভাবে সামঞ্জস্য করতে পারে
- প্রচুর ট্রেডিং সুযোগ: 15-মিনিটের সময় ফ্রেম যথেষ্ট ট্রেডিং সুযোগ প্রদান করে
- ভিজ্যুয়ালাইজেশনের উচ্চ ডিগ্রী: স্পষ্ট চার্ট লেআউট এবং সংকেত প্রদর্শন দ্রুত সিদ্ধান্ত নেওয়ার সুবিধা দেয়
- অটোমেশনের উচ্চ ডিগ্রি: সম্পূর্ণ সংকেত সিস্টেম স্বয়ংক্রিয় লেনদেন সম্পাদনকে সমর্থন করে
কৌশলগত ঝুঁকি
- বাজারের অস্থিরতার ঝুঁকি: উচ্চ-ফ্রিকোয়েন্সি ট্রেডিং অস্থির বাজারে স্লিপেজ ঝুঁকির সম্মুখীন হতে পারে
- মিথ্যা যুগান্তকারী ঝুঁকি: স্বল্প সময়ের জন্য মিথ্যা সংকেত তৈরি হতে পারে, যা ADX এর মাধ্যমে ফিল্টার করা প্রয়োজন
- তহবিল পরিচালনার ঝুঁকি: ঘন ঘন লেনদেনের ফলে হ্যান্ডলিং ফি জমা হতে পারে এবং অবস্থানগুলিকে যুক্তিসঙ্গতভাবে নিয়ন্ত্রণ করতে হবে।
- প্রযুক্তিগত ঝুঁকি: একাধিক সূচক বাজারের নির্দিষ্ট পরিস্থিতিতে পরস্পরবিরোধী সংকেত তৈরি করতে পারে
- এক্সিকিউশন ঝুঁকি: স্বয়ংক্রিয় ট্রেডিং সিস্টেমের জন্য একটি স্থিতিশীল নেটওয়ার্ক পরিবেশ এবং কার্যকর করার শর্ত প্রয়োজন
কৌশল অপ্টিমাইজেশনের দিকনির্দেশনা
- ইন্ডিকেটর প্যারামিটার অপ্টিমাইজেশান: প্রতিটি সূচক প্যারামিটারকে নির্দিষ্ট বাজারের অবস্থার জন্য আরও উপযুক্ত করতে ব্যাকটেস্টিংয়ের মাধ্যমে অপ্টিমাইজ করা যেতে পারে।
- সিগন্যাল ফিল্টারিং বর্ধিতকরণ: ভলিউম সূচকগুলি সহায়ক ফিল্টারিং শর্ত হিসাবে যোগ করা যেতে পারে
- ঝুঁকি নিয়ন্ত্রণের উন্নতি: বাজারের ওঠানামা অনুযায়ী লেনদেনের আকার সামঞ্জস্য করার জন্য একটি গতিশীল অবস্থান ব্যবস্থাপনা সিস্টেম চালু করা যেতে পারে
- টাইম উইন্ডো অপ্টিমাইজেশান: ট্রেডিং টাইম উইন্ডোগুলি বাজারের বিভিন্ন ধাপ অনুযায়ী গতিশীলভাবে সামঞ্জস্য করা যেতে পারে
- স্টপ-লস স্ট্র্যাটেজি অপ্টিমাইজেশান: লাভের সুরক্ষা উন্নত করতে একটি ট্রেলিং স্টপ-লস মেকানিজম চালু করা যেতে পারে
সারসংক্ষেপ
এই কৌশলটি একাধিক প্রযুক্তিগত সূচকের সমন্বয়ের মাধ্যমে উচ্চ-ফ্রিকোয়েন্সি ট্রেডিংয়ে সিগন্যাল ক্যাপচার এবং ঝুঁকি নিয়ন্ত্রণের মধ্যে ভারসাম্য অর্জন করে। স্পষ্ট ভিজ্যুয়াল ডিজাইন এবং সম্পূর্ণ অটোমেশন সহায়তা এটিকে আরও ব্যবহারিক করে তোলে। ঝুঁকি ব্যবস্থাপনার ক্রমাগত অপ্টিমাইজেশন এবং উন্নতির মাধ্যমে, কৌশলটি বিভিন্ন বাজার পরিবেশে স্থিতিশীল কর্মক্ষমতা বজায় রাখবে বলে আশা করা হচ্ছে। যদিও কিছু ঝুঁকি আছে, যুক্তিসঙ্গত প্যারামিটার সেটিংস এবং ঝুঁকি নিয়ন্ত্রণ ব্যবস্থার মাধ্যমে এই ঝুঁকিগুলি নিয়ন্ত্রণযোগ্য। কৌশলটির সফল প্রয়োগের জন্য ব্যবসায়ীদের বাজার সম্পর্কে গভীর ধারণা থাকা এবং ঝুঁকির উপর অবিরাম মনোযোগ বজায় রাখা প্রয়োজন।
/*backtest
start: 2019-12-23 08:00:00
end: 2024-12-25 08:00:00
period: 1d
basePeriod: 1d
exchanges: [{"eid":"Futures_Binance","currency":"BTC_USDT"}]
*/

//@version=5
strategy("Scalping BTC Ottimizzato - Grafica Chiara", shorttitle="Scalp BTC Opt", overlay=true, default_qty_type=strategy.percent_of_equity, default_qty_value=10)

// === 📊 INPUTS ===- 1