
Overview
This strategy is a high-frequency trading strategy based on a 15-minute timeframe. It combines multiple technical indicators including Exponential Moving Average (EMA), Relative Strength Index (RSI), Average Directional Index (ADX), and Average True Range (ATR) to achieve precise trade signal capture and dynamic risk management. The strategy features a clear visualization design for real-time monitoring of market conditions and trading signals.
Strategy Principles
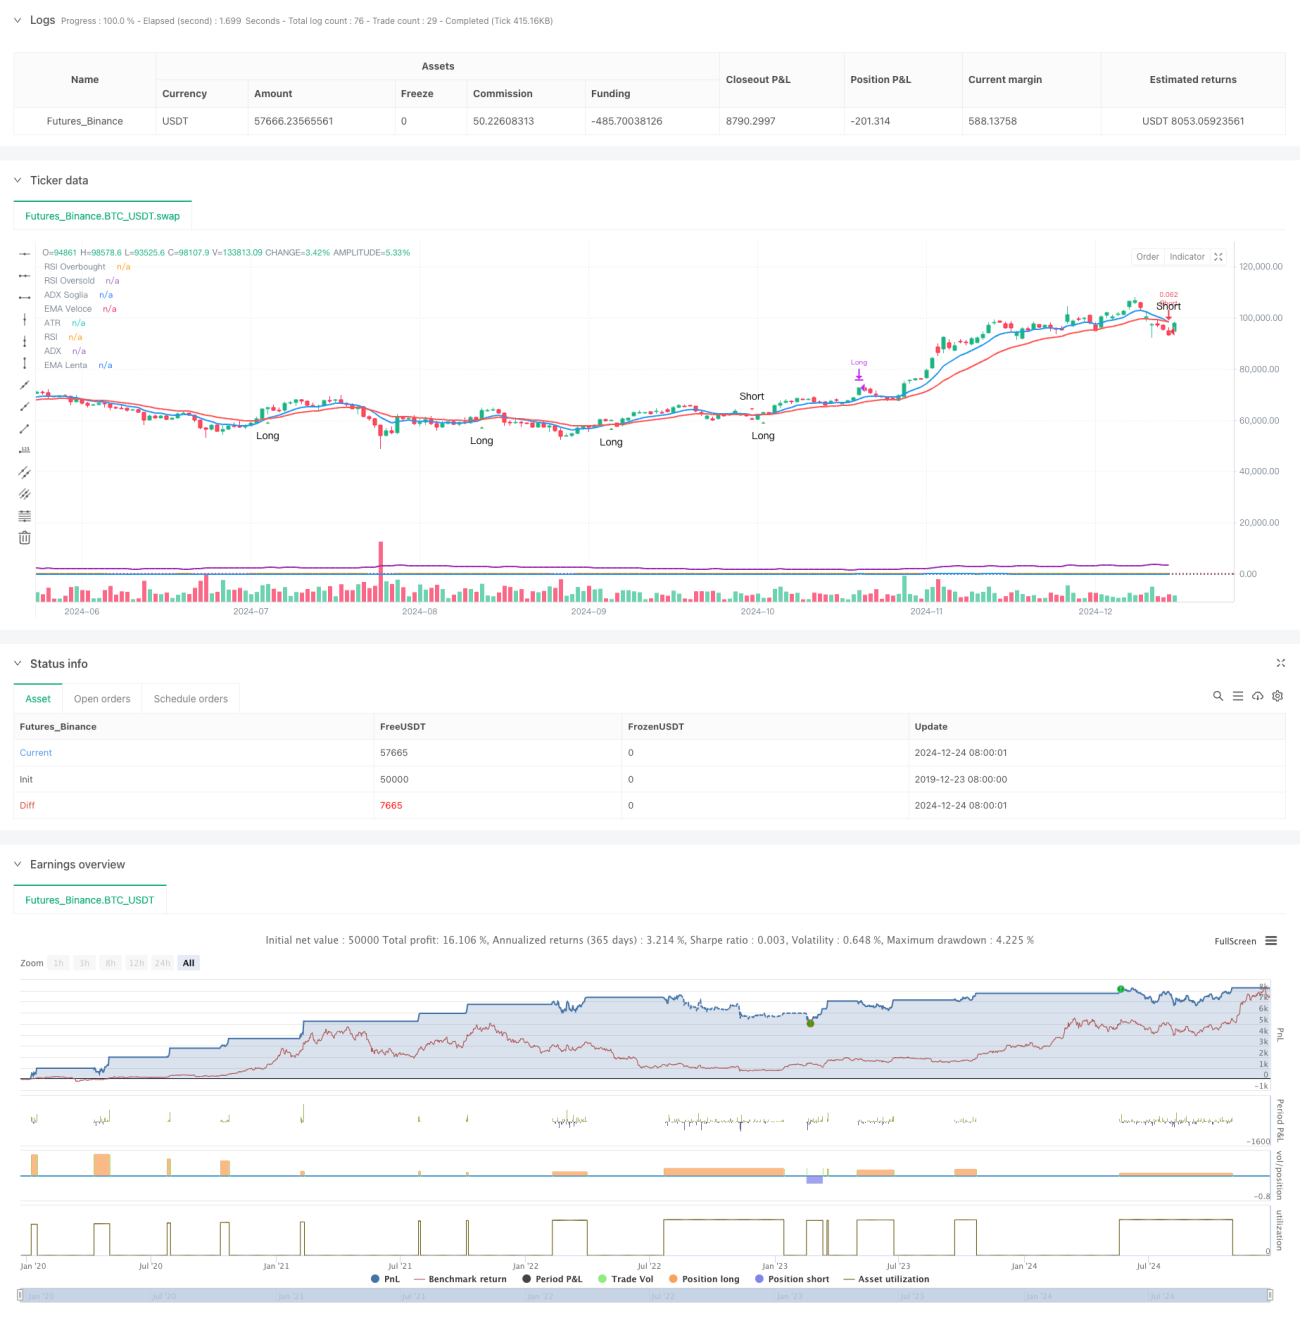
The core logic is based on the crossover of fast EMA (9 periods) and slow EMA (21 periods) to generate trading signals. RSI (14 periods) filters overbought/oversold zones, ADX (14 periods) confirms trend strength, and ATR (14 periods) dynamically sets stop-loss and take-profit levels. The combination of multiple technical indicators ensures signal reliability. Entry conditions include: Long - fast EMA crosses above slow EMA with RSI below 70 and ADX above 20; Short - fast EMA crosses below slow EMA with RSI above 30 and ADX above 20. Exits are managed through ATR-based dynamic stop-loss and take-profit levels.
Strategy Advantages
- High Signal Reliability: Cross-validation of multiple technical indicators significantly improves trading signal accuracy
- Flexible Risk Management: ATR-based dynamic stop-loss and take-profit settings automatically adjust to market volatility
- Abundant Trading Opportunities: 15-minute timeframe provides sufficient trading opportunities
- High Visualization: Clear chart layout and signal display facilitate quick decision-making
- High Automation: Complete signal system supports automated trade execution
Strategy Risks
- Market Volatility Risk: High-frequency trading may face slippage risk in volatile markets
- False Breakout Risk: Short timeframes may generate false signals, requiring ADX filtering
- Money Management Risk: Frequent trading may lead to accumulated fees, requiring proper position sizing
- Technical Risk: Multiple indicators may generate conflicting signals under certain market conditions
- Execution Risk: Automated trading systems require stable network environment and execution conditions
Strategy Optimization Directions
- Indicator Parameter Optimization: Parameters can be optimized through backtesting to better adapt to specific market conditions
- Signal Filter Enhancement: Volume indicators can be added as auxiliary filtering conditions
- Risk Control Improvement: Dynamic position management system can be introduced to adjust trading size based on market volatility
- Time Window Optimization: Trading time windows can be dynamically adjusted according to different market phases
- Stop-Loss Strategy Optimization: Trailing stop-loss mechanism can be introduced to improve profit protection
Summary
The strategy achieves a balance between signal capture and risk control in high-frequency trading through the synergy of multiple technical indicators. Clear visualization design and comprehensive automation support make it highly practical. Through continuous optimization and risk management improvements, the strategy shows promise for stable performance across different market environments. While risks exist, they can be controlled through proper parameter settings and risk control measures. Successful strategy implementation requires traders to have a deep understanding of the market and maintain continuous attention to risk.
/*backtest
start: 2019-12-23 08:00:00
end: 2024-12-25 08:00:00
period: 1d
basePeriod: 1d
exchanges: [{"eid":"Futures_Binance","currency":"BTC_USDT"}]
*/

//@version=5
strategy("Scalping BTC Ottimizzato - Grafica Chiara", shorttitle="Scalp BTC Opt", overlay=true, default_qty_type=strategy.percent_of_equity, default_qty_value=10)

// === 📊 INPUTS ===- 1