
Overview
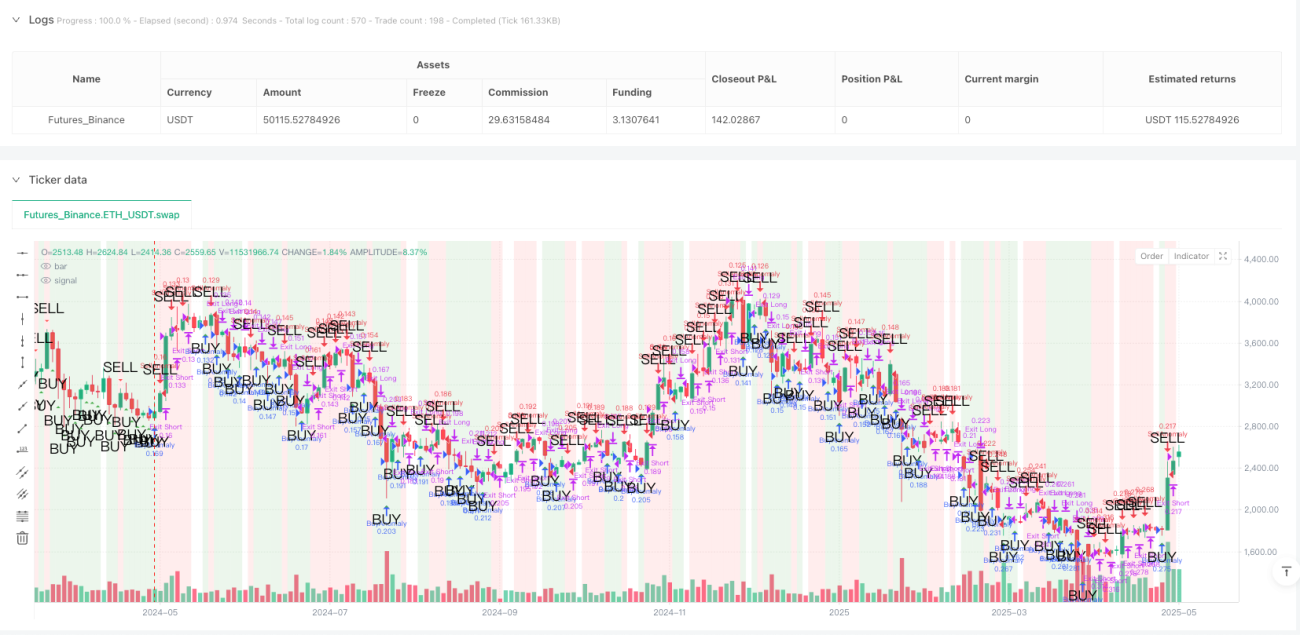
The Multi-Timeframe Anomaly Reversal Quantitative Trading Strategy is a mean-reversion trading system specifically designed to identify abnormal price movements in the market over short periods and take counter-trend positions after these anomalies occur. This strategy utilizes percentage change indicators to monitor price fluctuations over a specific timeframe, and when the fluctuation exceeds a preset threshold, the system automatically enters a counter-trend trade—shorting during abnormal price rises and going long during abnormal price drops. The strategy includes a complete risk management module, commission simulation, and slippage calculation, making it applicable to various market environments and timeframes.
Strategy Principles
The core logic of this strategy is based on the phenomenon that markets often "overreact" in the short term and then revert to the mean. The specific implementation is as follows:
-
Anomaly Detection Mechanism: Calculates the percentage price change over N minutes and compares it with a user-defined threshold. The strategy uses the request.security function to obtain price data from N minutes ago, ensuring time precision.
-
Trade Signal Generation:
- When the price rises above the threshold percentage within the set timeframe, the system identifies an "upward anomaly" and triggers a short signal
- When the price falls below the threshold percentage within the set timeframe, the system identifies a "downward anomaly" and triggers a long signal
-
Flexible Position Management: The strategy allows direct entry into long or short positions from flat positions, and also supports direct position reversal (long to short or short to long) without intermediate position closing steps.
-
Risk Control Mechanism: Each trade is set with fixed-point stop-loss and take-profit levels, using the strategy.exit function to strictly implement risk control.
-
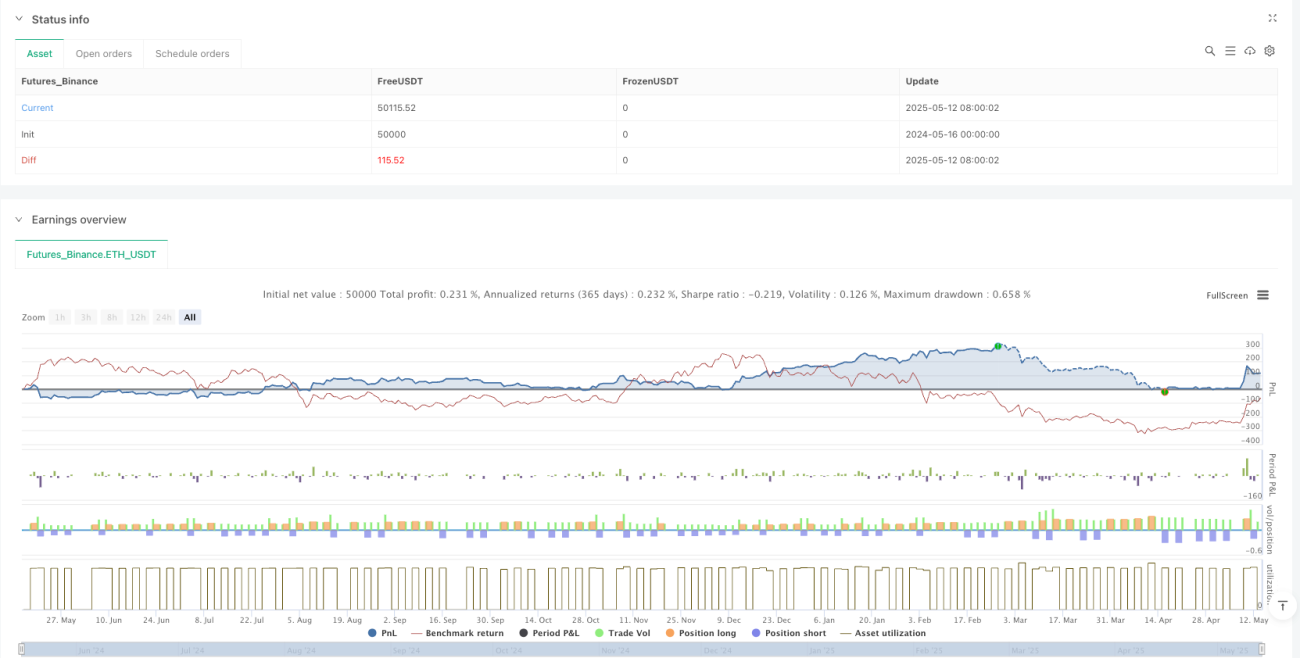
Real Trading Simulation Parameters: The strategy has built-in commission calculation (default 0.05%), slippage simulation (2 points), and position sizing based on account equity percentage, increasing the realism of backtesting.
-
Immediate Execution Logic: Through the process_orders_on_close=true setting, signals are executed immediately at the close of the candle, reducing delay.
Strategy Advantages
Through deep analysis of the strategy's code implementation, we can summarize the following significant advantages:
-
Strong Market Adaptability: The strategy can be applied to any trading instrument and timeframe, with users only needing to adjust the percentage threshold and lookback period according to the volatility characteristics of different instruments.
-
Precise Anomaly Identification: By using 1-minute precision data to calculate price changes, the strategy maintains accuracy in anomaly detection even over longer timeframes.
-
Automated Trading Logic: Without manual intervention, the system can automatically identify anomalies and execute trades, reducing the impact of emotional factors.
-
Complete Risk Control: Built-in stop-loss and take-profit mechanisms ensure that each trade has a predetermined risk range, avoiding excessive losses from individual trades.
-
Visual Aid Functions: Through configurable chart markers (triangular buy/sell signals and background highlights), traders can visually identify anomaly periods, improving analysis efficiency.
-
Realistic Market Cost Simulation: Consideration of commissions, slippage, and position sizing makes backtest results closer to real trading performance.
-
Flexible Position Management: Support for direct transitions between flat→long/short, long→short, and short→long without intermediate steps improves the strategy's reaction speed in volatile markets.
Strategy Risks
Despite its comprehensive design, this strategy still presents some potential risks and challenges:
-
Trend Market Risk: In strong trending markets, prices may not quickly revert but continue to move in the same direction, causing counter-trend trades to face continuous losses. A solution is to add trend filters that pause strategy execution when strong trends are identified.
-
Parameter Sensitivity: Strategy performance is highly dependent on the settings of percentage threshold and lookback period. Optimal parameters can vary greatly in different market environments. Comprehensive parameter optimization and backtesting are recommended, with periodic reassessment.
-
Abnormal Market Risk: During major news or black swan events, prices may gap or experience extreme volatility, and stop-losses may not execute at expected prices. Consider adding volatility filters to reduce position size or pause trading during abnormally high volatility.
-
Liquidity Considerations: In low-liquidity markets, large orders may increase slippage, affecting strategy performance. It's advisable to apply this strategy in markets with sufficient liquidity or add liquidity judgment conditions.
-
Fixed Stop-Loss Limitations: The strategy uses fixed-point stop-loss and take-profit levels without considering changes in market volatility. Consider using dynamic stop-loss settings based on ATR or volatility.
Strategy Optimization Directions
Based on in-depth analysis of the code, here are several possible optimization directions:
-
Add Trend Filters: By adding trend indicators (such as moving averages, ADX, etc.) to avoid counter-trend trading in strong trends. This can significantly reduce false signals and improve win rates. For example, only allow reversal trades when ADX is below a specific threshold (indicating no obvious trend).
-
Dynamic Parameter Adjustment: Automatically adjust percentage thresholds and stop-loss ranges based on market volatility. The ATR indicator can be used to measure market volatility, increasing thresholds during high volatility periods and decreasing them during low volatility periods.
-
Multi-Timeframe Confirmation: Add multi-timeframe analysis, only trading when anomalies are shown across multiple timeframes, which can improve signal quality.
-
Add Trading Time Filters: Some markets are more prone to mean reversion during specific time periods. By limiting trading hours, unfavorable market sessions can be avoided.
-
Optimize Position Management: The current strategy uses fixed proportion money management. Consider adjusting position size based on signal strength or current market volatility, increasing positions in more promising trades.
-
Add Trailing Stop-Loss: After a trade enters profit territory, a trailing stop-loss mechanism can be introduced to lock in partial profits while allowing profits to continue growing.
-
Add Volume Confirmation: Abnormal price movements are usually accompanied by significant changes in volume. Adding volume filter conditions can improve signal reliability.
Summary
The Multi-Timeframe Anomaly Reversal Quantitative Trading Strategy is a well-designed mean reversion trading system that captures price reversion opportunities by precisely identifying short-term market anomalies and taking counter-trend positions. This strategy combines multiple features including anomaly detection, risk management, and real trading simulation, making it applicable to various trading instruments and timeframes.
The main advantages of the strategy lie in its automated anomaly identification mechanism, comprehensive risk control, and flexible position management, enabling it to capture reversal opportunities in volatile markets. However, it may face challenges in strong trending markets, requiring optimization through the addition of trend filters and other methods.
Through the addition of multi-timeframe confirmation, dynamic parameter adjustment, and optimized position management, this strategy has significant room for improvement. For quantitative traders, this is a valuable strategy framework that can be further developed and customized, particularly suited for market environments that frequently exhibit overreactions followed by mean reversion.
- 1