ওভারভিউ
এই কৌশলটি একটি স্বনির্ধারিত প্রবণতা ট্র্যাকিং সিস্টেম যা নাদারায়া-ওয়াটসন কোর রিগ্রেশন এবং এটিআর ডায়নামিক ওয়েভব্যান্ডের সমন্বয় করে। এটি যুক্তিসঙ্গত দ্বৈত কোর ফাংশন দ্বারা মূল্য প্রবণতা পূর্বাভাস দেয় এবং এটিআর-ভিত্তিক গতিশীল সমর্থন এবং প্রতিরোধের মাধ্যমে ব্যবসায়ের সুযোগগুলি সনাক্ত করতে ব্যবহার করে। সিস্টেমটি কনফিগারযোগ্য রিটার্ন উইন্ডো এবং ওজন প্যারামিটারগুলির মাধ্যমে বাজারের সঠিক মডেলিং সক্ষম করে।
কৌশল নীতি
কৌশলটির কেন্দ্রবিন্দু হল নাদারায়া-ওয়াটসন পদ্ধতির উপর ভিত্তি করে নন-প্যারামিটারিক নিউক্লিয়ার রিগ্রেশন, যা যুক্তিসঙ্গত ডাবল-ক্লিয়ার ফাংশন ব্যবহার করে মূল্যের ক্রমকে মসৃণ করে। রিগ্রেশনটি সেট করা শুরু বার থেকে শুরু হয়, দুটি মূল প্যারামিটারগুলি নিয়ন্ত্রণ করে ফর্ম্যাটের মাত্রা নিয়ন্ত্রণ করে lookback window ((h) এবং আপেক্ষিক ওজন (® । এটিআর সূচকগুলির সাথে মিলিত করে একটি গতিশীল ব্যাপ্তি তৈরি করা হয়, যার উপরের এবং নীচের ব্যাপ্তিগুলি পুনরুদ্ধার করা হয় যা অনুমান করা হয় যে এটিআর বৃদ্ধি এবং হ্রাসের গুণিতক। সিস্টেমটি দামের সাথে ব্যাপ্তিগুলির ক্রস দ্বারা একটি ট্রেডিং সিগন্যাল ট্রিগার করে - যখন দাম নীচের ব্যাপ্তিটি অতিক্রম করে তখন বেশি করে, যখন এটি একটি ফাঁকা সময় অতিক্রম করে। প্রবণতা বিচার করা যেতে পারে দামের পরিবর্তনের হার বা ক্রসিংয়ের উপর ভিত্তি করে এবং রঙের পরিবর্তন দ্বারা প্রদর্শিত হয়।
কৌশলগত সুবিধা
- পারমাণবিক রিগ্রেশন পদ্ধতির একটি ভাল গাণিতিক ভিত্তি রয়েছে যা মূল্যের প্রবণতাকে কার্যকরভাবে ধরা দেয় এবং অত্যধিক ফিট না করে
- ডায়নামিক ওয়েভব্যান্ডগুলি বাজারের অস্থিরতার সাথে সামঞ্জস্য করে এবং আরও যুক্তিসঙ্গত সমর্থন প্রতিরোধের স্থান সরবরাহ করে
- প্যারামিটারগুলি কনফিগারযোগ্য, বিভিন্ন বাজারের বৈশিষ্ট্য অনুসারে নমনীয়ভাবে সামঞ্জস্য করা যায়
- প্রবণতা সনাক্তকরণ প্রক্রিয়া নমনীয়, মসৃণ বা সংবেদনশীল মোড নির্বাচন করতে পারে
- ভিজ্যুয়ালাইজেশন সহজবোধ্য, ট্রেডিং সিগন্যাল পরিষ্কার
কৌশলগত ঝুঁকি
- অপ্রয়োজনীয় প্যারামিটার নির্বাচন ওভারফিট বা লেগ হতে পারে
- অস্থির বাজারে অতিরিক্ত ট্রেডিং সিগন্যাল হতে পারে
- অযৌক্তিক ATR গুণক সেট করা হয়েছে যার ফলে স্টপ লস খুব বড় বা খুব ছোট হতে পারে
- প্রবণতা পরিবর্তনের সময় ভুল সংকেত দেখা দিতে পারে ঐতিহাসিক পুনর্বিবেচনার মাধ্যমে প্যারামিটারগুলিকে অপ্টিমাইজ করার পরামর্শ দেওয়া হয়, এবং অন্যান্য সূচকগুলির সাথে সহযোগিতামূলক নিশ্চিতকরণ হিসাবে।
কৌশল অপ্টিমাইজেশনের দিকনির্দেশনা
- প্রবণতা নিশ্চিতকরণের জন্য ট্রানজিট সূচক প্রবর্তন
- স্বনির্ধারিত প্যারামিটার অপ্টিমাইজেশান বিকাশ
- প্রবণতা বৃদ্ধি তীব্রতা ফিল্টার কম ঝাঁকুনি বাজার মিথ্যা সংকেত
- অপ্টিমাইজড স্টপ লস স্টপ মেকানিজম লাভের হার বাড়ায়
- বিভিন্ন বাজারে বিভিন্ন প্যারামিটার ব্যবহার করে বাজার পরিবেশে শ্রেণিবদ্ধকরণ অন্তর্ভুক্ত করার কথা বিবেচনা করুন
সারসংক্ষেপ
এই কৌশলটি প্রযুক্তিগত বিশ্লেষণের সাথে পরিসংখ্যানগত শিক্ষার পদ্ধতিগুলি একত্রিত করে একটি দৃ the়, ব্যবহারিক ট্রেডিং সিস্টেম তৈরি করে। এর স্বতঃস্ফূর্ত বৈশিষ্ট্য এবং কনফিগারযোগ্যতা এটিকে বিভিন্ন বাজারের পরিবেশের সাথে খাপ খাইয়ে নিতে সক্ষম করে, তবে ব্যবহারের সময় প্যারামিটার অপ্টিমাইজেশন এবং ঝুঁকি নিয়ন্ত্রণের দিকে মনোযোগ দেওয়া প্রয়োজন। ক্রমাগত উন্নতি এবং অপ্টিমাইজেশনের মাধ্যমে, কৌশলটি বাস্তব যুদ্ধের ব্যবসায়ের ক্ষেত্রে গুরুত্বপূর্ণ ভূমিকা পালন করবে বলে আশা করা হচ্ছে।
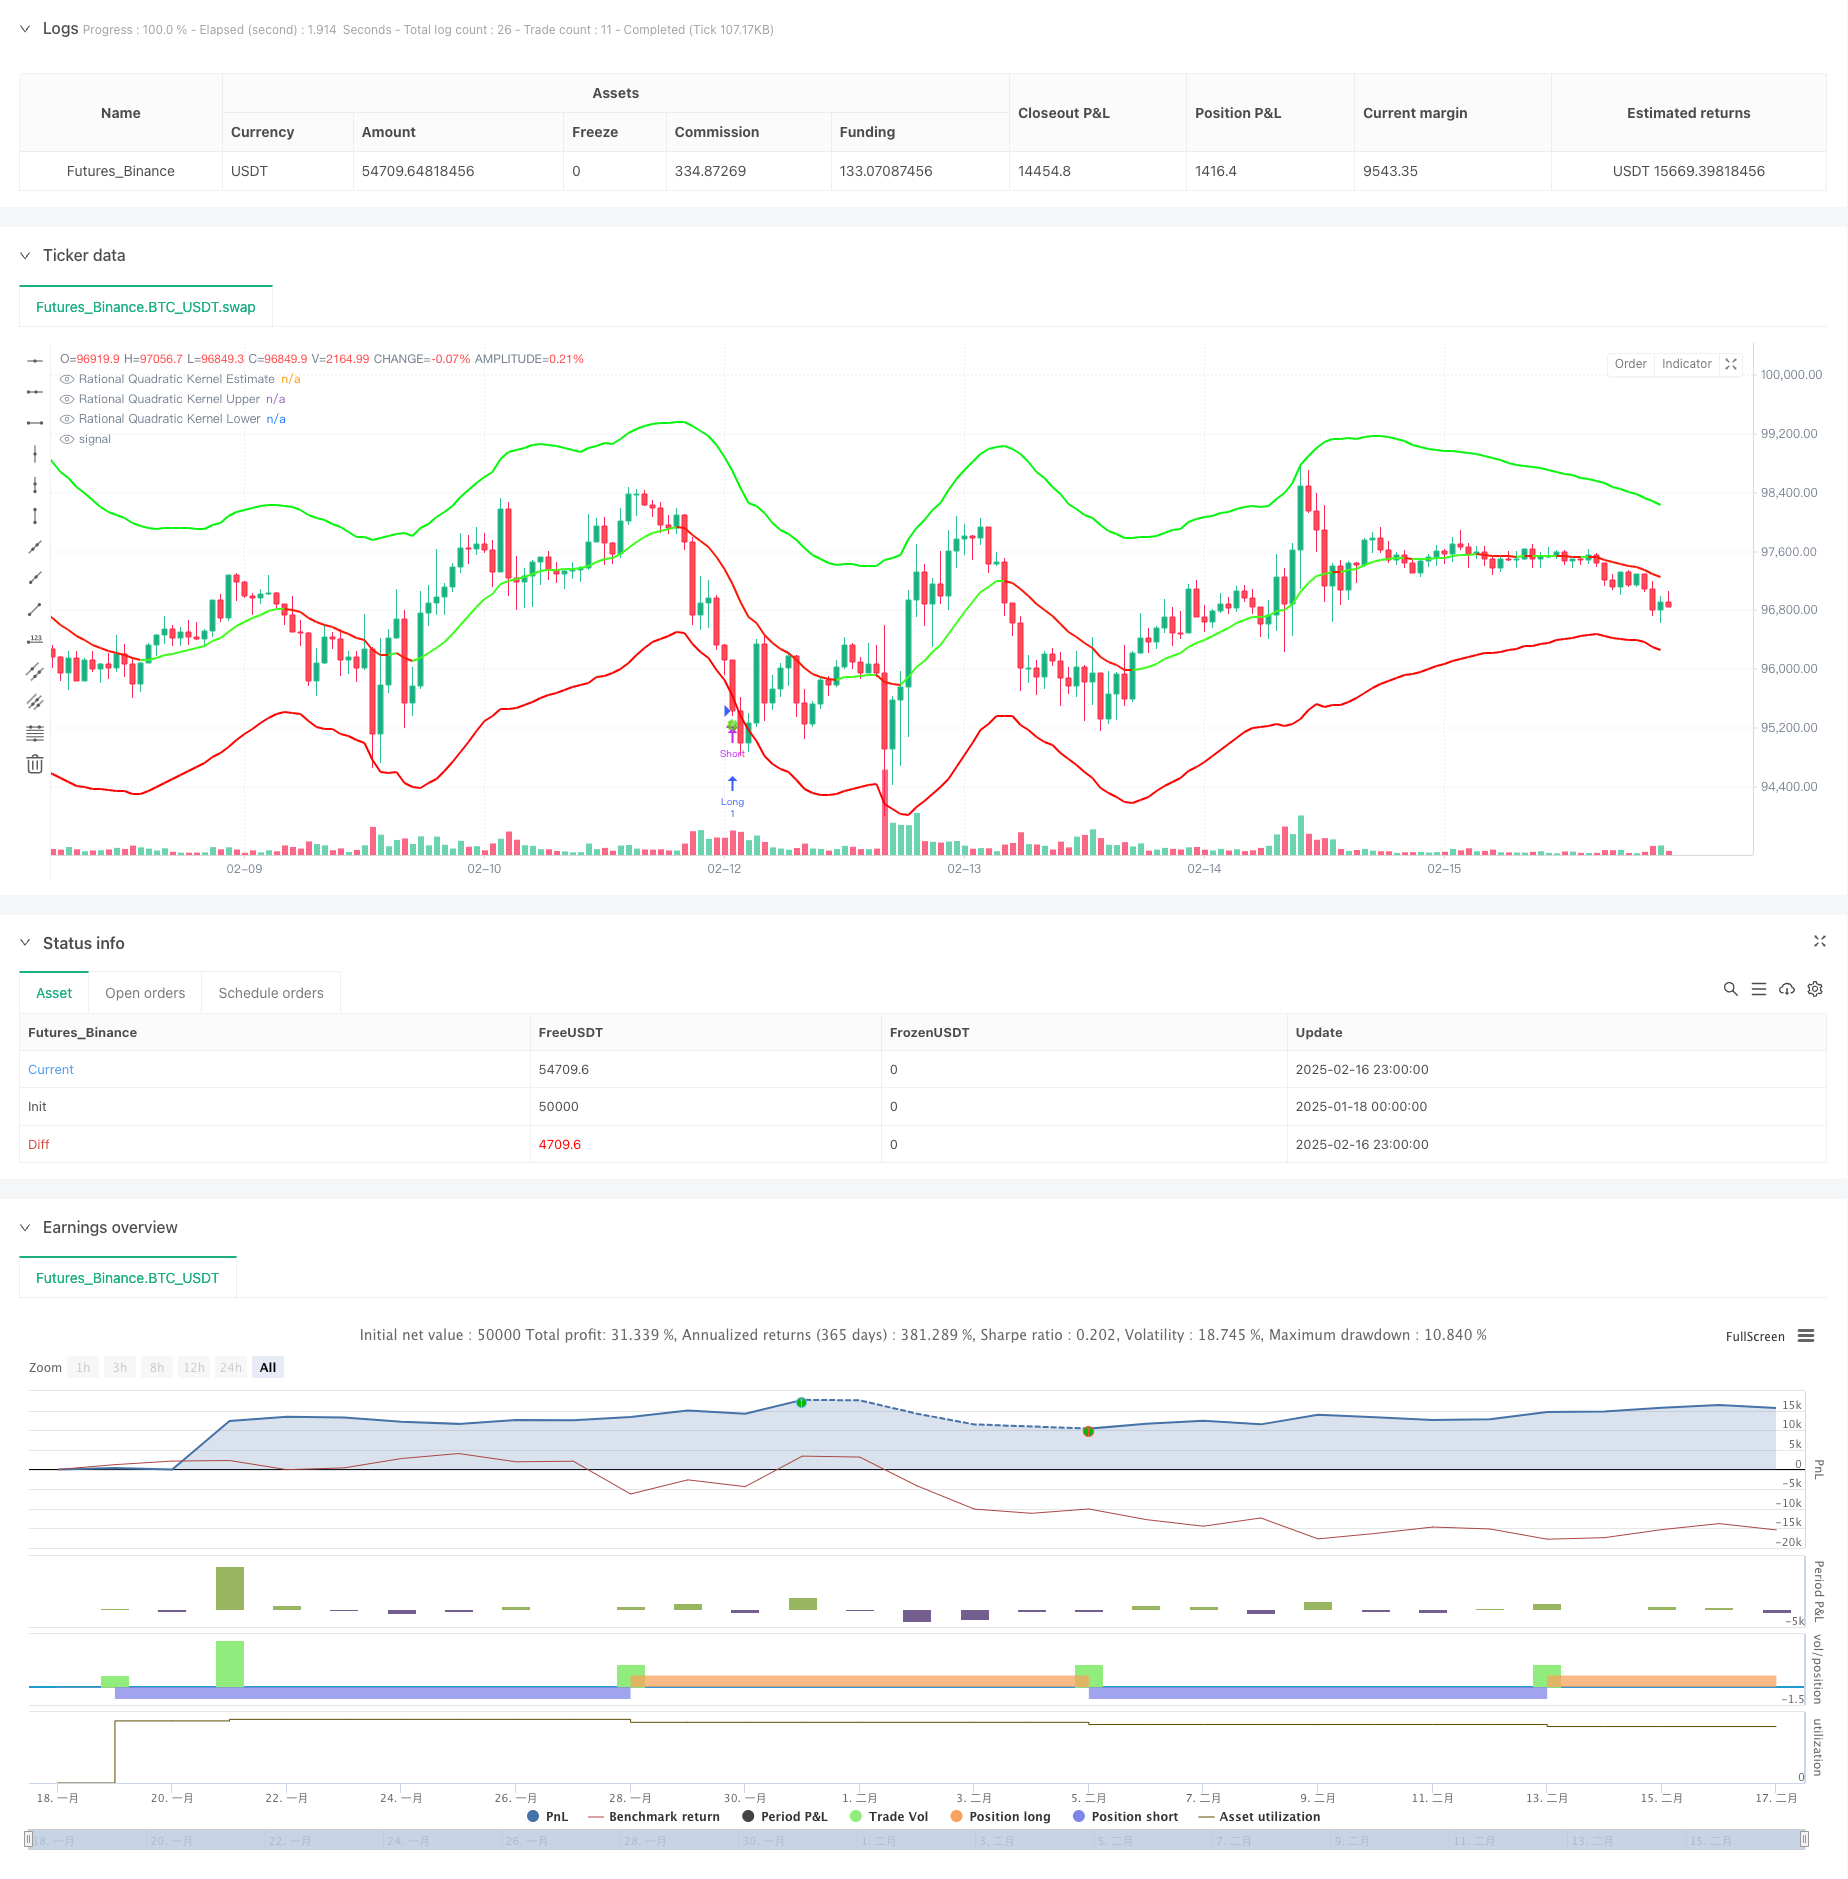
/*backtest
start: 2025-01-18 00:00:00
end: 2025-02-17 00:00:00
period: 1h
basePeriod: 1h
exchanges: [{"eid":"Futures_Binance","currency":"BTC_USDT"}]
*/

// This source code is subject to the terms of the Mozilla Public License 2.0 at https://mozilla.org/MPL/2.0/
// © Lupown

//@version=5
strategy("Nadaraya-Watson non repainting Strategy", overlay=true)  // PARAMETER timeframe ODSTRÁNENÝ

//--------------------------------------------------------------------------------
// INPUTS
//--------------------------------------------------------------------------------
src = input.source(close, 'Source')
h   = input.float(8., 'Lookback Window', minval=3., tooltip='The number of bars used for the estimation. This is a sliding value that represents the most recent historical bars. Recommended range: 3-50')
r   = input.float(8., 'Relative Weighting', step=0.25, tooltip='Relative weighting of time frames. As this value approaches zero, the longer time frames will exert more influence on the estimation. As this value approaches infinity, the behavior of the Rational Quadratic Kernel will become identical to the Gaussian kernel. Recommended range: 0.25-25')
x_0 = input.int(25, "Start Regression at Bar", tooltip='Bar index on which to start regression. The first bars of a chart are often highly volatile, and omission of these initial bars often leads to a better overall fit. Recommended range: 5-25')
showMiddle    = input.bool(true, "Show middle band")
smoothColors  = input.bool(false, "Smooth Colors", tooltip="Uses a crossover based mechanism to determine colors. This often results in less color transitions overall.", inline='1', group='Colors')
lag           = input.int(2, "Lag", tooltip="Lag for crossover detection. Lower values result in earlier crossovers. Recommended range: 1-2", inline='1', group='Colors')

lenjeje = input.int(32, "ATR Period",    tooltip="Period to calculate upper and lower band", group='Bands')
coef    = input.float(2.7, "Multiplier", tooltip="Multiplier to calculate upper and lower band", group='Bands')

//--------------------------------------------------------------------------------
// ARRAYS & VARIABLES
//--------------------------------------------------------------------------------
float y1 = 0.0
float y2 = 0.0
srcArray = array.new<float>(0)
array.push(srcArray, src)
size = array.size(srcArray)

//--------------------------------------------------------------------------------
// KERNEL REGRESSION FUNCTIONS
//--------------------------------------------------------------------------------
kernel_regression1(_src, _size, _h) =>
    float _currentWeight = 0.
    float _cumulativeWeight = 0.
    for i = 0 to _size + x_0
        y = _src[i]
        w = math.pow(1 + (math.pow(i, 2) / ((math.pow(_h, 2) * 2 * r))), -r)
        _currentWeight    += y * w
        _cumulativeWeight += w
    [_currentWeight, _cumulativeWeight]

[currentWeight1, cumulativeWeight1] = kernel_regression1(src, size, h)
yhat1 = currentWeight1 / cumulativeWeight1

[currentWeight2, cumulativeWeight2] = kernel_regression1(src, size, h - lag)
yhat2 = currentWeight2 / cumulativeWeight2

//--------------------------------------------------------------------------------
// TREND & COLOR DETECTION
//--------------------------------------------------------------------------------
// Rate-of-change-based
bool wasBearish   = yhat1[2] > yhat1[1]
bool wasBullish   = yhat1[2] < yhat1[1]
bool isBearish    = yhat1[1] > yhat1
bool isBullish    = yhat1[1] < yhat1
bool isBearishChg = isBearish  and wasBullish
bool isBullishChg = isBullish  and wasBearish

// Crossover-based (for "smooth" color changes)
bool isBullishCross  = ta.crossover(yhat2, yhat1)
bool isBearishCross  = ta.crossunder(yhat2, yhat1)
bool isBullishSmooth = yhat2 > yhat1
bool isBearishSmooth = yhat2 < yhat1

color c_bullish    = input.color(#3AFF17, 'Bullish Color', group='Colors')
color c_bearish    = input.color(#FD1707, 'Bearish Color', group='Colors')

color colorByCross = isBullishSmooth ? c_bullish : c_bearish
color colorByRate  = isBullish       ? c_bullish : c_bearish
color plotColor    = smoothColors ? colorByCross : colorByRate

// Middle Estimate
plot(showMiddle ? yhat1 : na, "Rational Quadratic Kernel Estimate", color=plotColor, linewidth=2)

//--------------------------------------------------------------------------------
// UPPER / LOWER BANDS
//--------------------------------------------------------------------------------
upperjeje = yhat1 + coef * ta.atr(lenjeje)
lowerjeje = yhat1 - coef * ta.atr(lenjeje)

plotUpper = plot(upperjeje, "Rational Quadratic Kernel Upper", color=color.rgb(0, 247, 8), linewidth=2)
plotLower = plot(lowerjeje, "Rational Quadratic Kernel Lower", color=color.rgb(255, 0, 0), linewidth=2)

//--------------------------------------------------------------------------------
// SYMBOLS & ALERTS
//--------------------------------------------------------------------------------
plotchar(ta.crossover(close, upperjeje),  char="🥀", location=location.abovebar, size=size.tiny)
plotchar(ta.crossunder(close, lowerjeje), char="🍀", location=location.belowbar, size=size.tiny)

// Alerts for Color Changes (estimator)
alertcondition(smoothColors ? isBearishCross : isBearishChg, title="Bearish Color Change", message="Nadaraya-Watson: {{ticker}} ({{interval}}) turned Bearish ▼")
alertcondition(smoothColors ? isBullishCross : isBullishChg, title="Bullish Color Change", message="Nadaraya-Watson: {{ticker}} ({{interval}}) turned Bullish ▲")

// Alerts when price crosses upper and lower band
alertcondition(ta.crossunder(close, lowerjeje), title="Price close under lower band", message="Nadaraya-Watson: {{ticker}} ({{interval}}) crossed under lower band 🍀")
alertcondition(ta.crossover(close, upperjeje),  title="Price close above upper band", message="Nadaraya-Watson: {{ticker}} ({{interval}}) Crossed above upper band 🥀")

//--------------------------------------------------------------------------------
// STRATEGY LOGIC (EXAMPLE)
//--------------------------------------------------------------------------------
if ta.crossunder(close, lowerjeje)
    // zatvoriť short
    strategy.close("Short")
    // otvoriť long
    strategy.entry("Long", strategy.long)

if ta.crossover(close, upperjeje)
    // zatvoriť long
    strategy.close("Long")
    // otvoriť short
    strategy.entry("Short", strategy.short)