মাল্টি-পিরিয়ড ডনচিয়ান ইন্ডিকেটর ট্রেন্ড ফলোয়িং এবং ডাইভারজেন্স ট্রেডিং কৌশল

ওভারভিউ
এই কৌশলটি বহু-চক্রের ডানচিয়ান চ্যানেলের সূচকগুলির উপর ভিত্তি করে একটি প্রবণতা ট্র্যাকিং সিস্টেম তৈরি করে। বিভিন্ন সময়কালের ডানচিয়ান চ্যানেলের ব্রেকডাউনগুলি বিশ্লেষণ করে, প্রধান প্রবণতা এবং স্থানীয় প্রবণতার সমন্বয়যুক্ত সম্পর্কগুলিকে একত্রিত করে, একটি দৃশ্যমান প্রবণতা-ব্যান্ডযুক্ত গ্রাফ গঠন করে। কৌশলটি প্রবণতার দুর্বলতা দেখানোর জন্য রঙের গভীর পরিবর্তন ব্যবহার করে, সবুজ অঞ্চলটি উত্থান প্রবণতা প্রতিনিধিত্ব করে, লাল অঞ্চলটি নিম্ন প্রবণতা প্রতিনিধিত্ব করে, রঙের গভীরতা প্রবণতা আরও স্পষ্ট।
কৌশল নীতি
কৌশলটির মূল অংশটি হ'ল ডনচিয়ান চ্যানেলের সূচকগুলির উপর ভিত্তি করে প্রবণতা নির্ধারণ করা। ডনচিয়ান চ্যানেলটি সর্বোচ্চ মূল্যের চ্যানেল এবং সর্বনিম্ন মূল্যের চ্যানেলের সমন্বয়ে গঠিত, যা বর্তমান মূল্যের সাথে চ্যানেলের অবস্থানের সম্পর্কের তুলনা করে প্রবণতা নির্ধারণ করে। প্রধানত নিম্নলিখিত কয়েকটি মূল উপাদান রয়েছেঃ
- মূল প্রবণতা বিচারঃ 20 পিরিয়ড দং চিয়ান চ্যানেল ব্যবহার করে, যখন দাম উর্ধ্বগামী ট্র্যাকটি ভেঙে একটি উচ্চ প্রবণতা গঠন করে, নীচের ট্র্যাকটি ভেঙে একটি নিম্নগামী প্রবণতা গঠন করে
- স্থানীয় প্রবণতা নির্ণয়ঃ প্রধান প্রবণতা কাঠামোর অধীনে, স্থানীয় প্রবণতার গতিপথ নির্ণয় করার জন্য স্বল্প-চক্রের দং চিয়াং চ্যানেল ব্যবহার করা হয়
- প্রবণতা-ব্যান্ডযুক্ত গ্রাফঃ 10 টি বিভিন্ন সময়কালের সাথে ডং চিয়ান চ্যানেলের সংমিশ্রণ দ্বারা প্রবণতা-ব্যান্ডগুলি গঠিত হয়, রঙগুলি গভীর এবং হালকা প্রবণতার শক্তিকে প্রতিফলিত করে
- ট্রেডিং সিগন্যালঃ মেইন ট্রেন্ড ওপরে, মেইন ট্রেন্ড নিচে, মেইন ট্রেন্ড খালি, ট্রেন্ড বিপরীত
কৌশলগত সুবিধা
- প্রবণতা মূল্যায়নঃ প্রবণতা মূল্যায়ন মূল্যের উপর ভিত্তি করে, স্বতন্ত্র বিচারের দ্বারা সৃষ্ট বিচ্যুতি এড়ানো
- মাল্টি-সাইক্লিক নিশ্চিতকরণঃ বিভিন্ন চক্রের প্রবণতাগুলির উপর ভিত্তি করে প্রবণতা বিচারকে উন্নত করা
- ভিজ্যুয়াল ইফেক্টগুলি স্বজ্ঞাতঃ ট্রেন্ড বারের রঙের পরিবর্তনগুলি স্বজ্ঞাতভাবে বাজার অবস্থা দেখায়
- লেনদেনের নিয়ম সুস্পষ্টঃ প্রবেশ ও প্রস্থান সংকেতগুলি স্পষ্ট, সহজেই প্রোগ্রাম করা যায়
- অভিযোজনযোগ্যতাঃ কৌশলগত কর্মক্ষমতা অনুকূলিতকরণ প্যারামিটারগুলি ট্রেডিং জাতের বৈশিষ্ট্য অনুসারে সামঞ্জস্য করা যায়
কৌশলগত ঝুঁকি
- ট্রেন্ড রিভার্সনের ঝুঁকিঃ ট্রেন্ড রিভার্সনে বড় ধরনের প্রত্যাহারের সম্ভাবনা রয়েছে
- অস্থিরতা বাজার প্রযোজ্য নয়ঃ ডাইভারজেন্ট অস্থিরতা প্রবণতা মিথ্যা সংকেত তৈরি করতে পারে
- প্যারামিটার সংবেদনশীলতাঃ বিভিন্ন প্যারামিটার সেটিংগুলি কৌশলটির কার্যকারিতা উল্লেখযোগ্যভাবে প্রভাবিত করে
- স্লাইড পয়েন্ট প্রভাবঃ ঘন ঘন লেনদেন স্লাইড পয়েন্ট দ্বারা প্রভাবিত হতে পারে
- ব্যবস্থার ঝুঁকিঃ বাজারে হঠাৎ ঘটনার ফলে বড় ধরনের ক্ষতি হতে পারে
কৌশল অপ্টিমাইজেশনের দিকনির্দেশনা
- প্রবণতা শক্তি ফিল্টারিং বৃদ্ধি করুনঃ প্রবণতা শক্তি সূচক যেমন ADX চালু করুন, দুর্বল প্রবণতা সংকেত ফিল্টার করুন
- অপ্টিমাইজড স্টপ সেটিংঃ এটিআর-এর উপর ভিত্তি করে স্টপ পজিশনের গতিশীলতা, যা ঝুঁকি নিয়ন্ত্রণের ক্ষমতা বাড়ায়
- ট্রানজিট নিশ্চিতকরণ যোগ করুনঃ ট্রানজিট বিশ্লেষণের সমন্বয়ে প্রবণতার কার্যকারিতা যাচাই করুন
- উর্ধ্বমুখীতা অভিযোজনঃ বাজারের উর্ধ্বমুখীতার উপর ভিত্তি করে গতিশীল সমন্বয় প্যারামিটার
- পজিশন ম্যানেজমেন্ট উন্নত করুনঃ প্রবণতা শক্তির উপর ভিত্তি করে পজিশন হোল্ডিংয়ের আকার পরিবর্তন করুন
সারসংক্ষেপ
এই কৌশলটি একাধিক চক্রের ডং চিয়াং চ্যানেলের উদ্ভাবনী প্রয়োগের মাধ্যমে একটি দৃশ্যমান, যুক্তিসঙ্গতভাবে স্পষ্ট প্রবণতা ট্র্যাকিং ট্রেডিং সিস্টেম তৈরি করেছে। কৌশলটির মূল সুবিধা হ'ল জটিল প্রবণতা বিশ্লেষণ প্রক্রিয়াটি ভিজ্যুয়ালাইজ করা, যা ব্যবসায়ীদের বাজারের গতিবিধিকে সহজেই উপলব্ধি করতে সহায়তা করে। যুক্তিসঙ্গত প্যারামিটার অপ্টিমাইজেশন এবং ঝুঁকি নিয়ন্ত্রণ ব্যবস্থাগুলির সাথে, কৌশলটির ভাল রিয়েল-টাইম অ্যাপ্লিকেশন মূল্য রয়েছে। ব্যবসায়ীদের রিয়েল-টাইম প্রয়োগের সময় বাজারের পরিবেশের পছন্দগুলি বিবেচনা করার পরামর্শ দেওয়া হয় এবং তাদের ঝুঁকি সহনশীলতার সাথে পজিশন পরিচালনার পরামর্শ দেওয়া হয়।
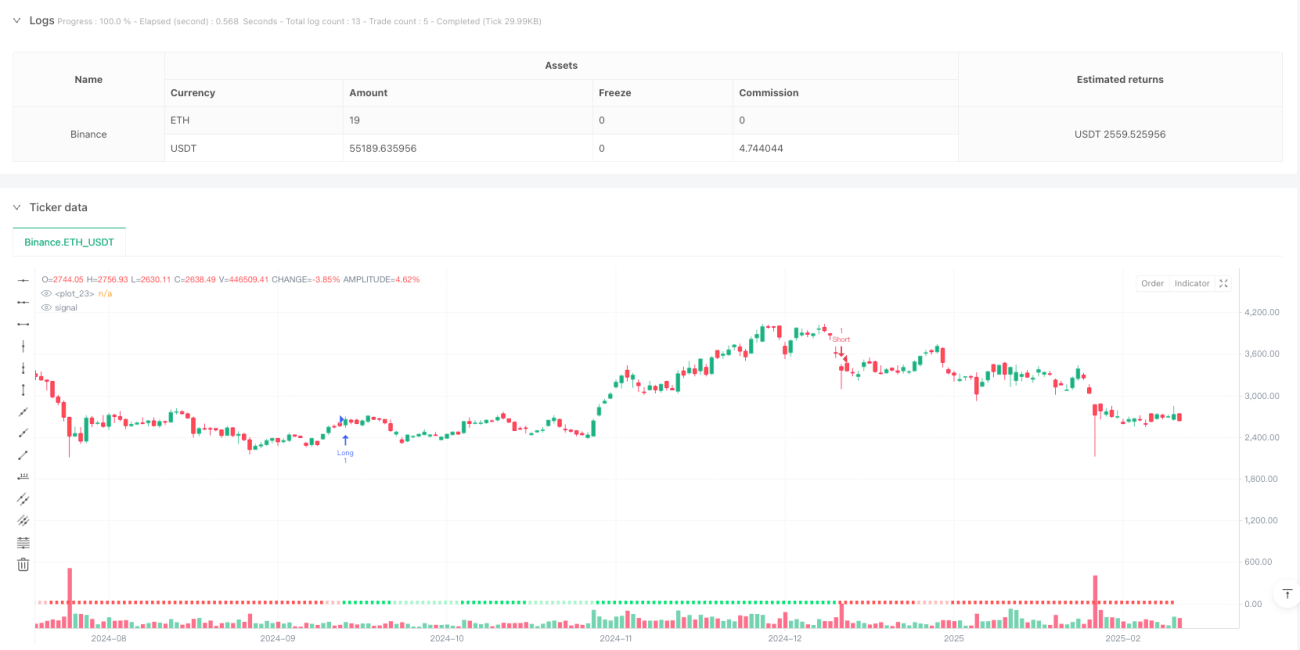
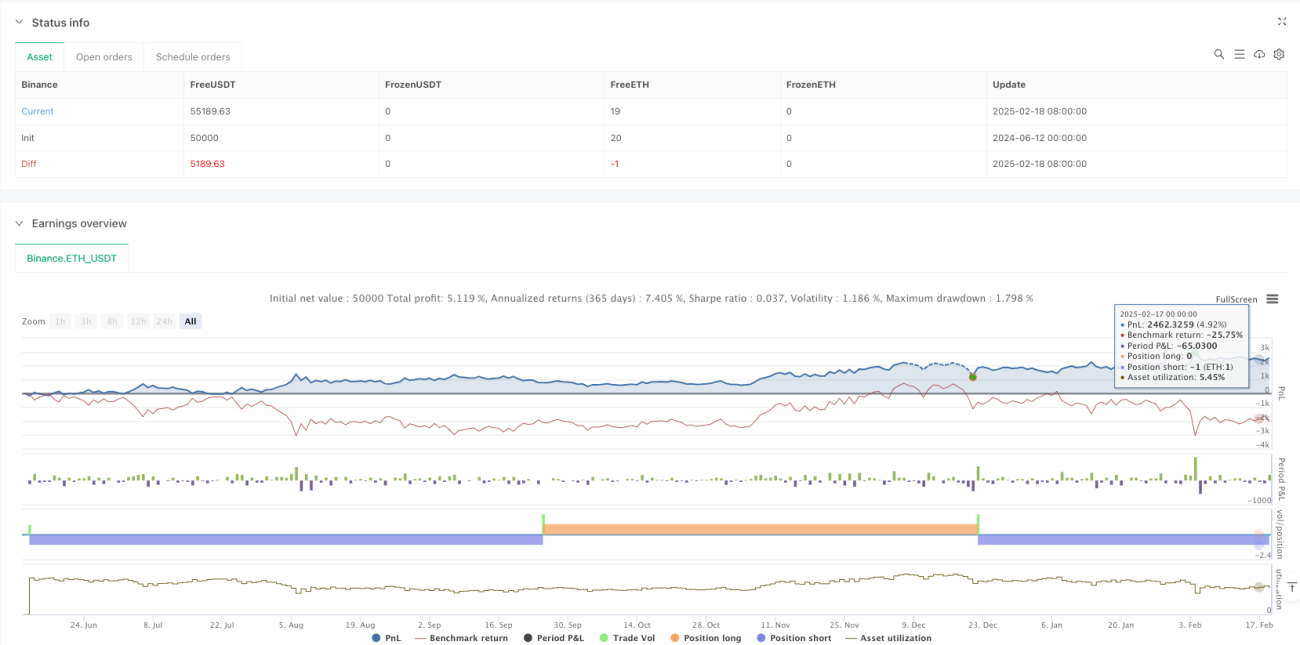
/*backtest
start: 2024-06-12 00:00:00
end: 2025-02-19 08:00:00
period: 1d
basePeriod: 1d
exchanges: [{"eid":"Binance","currency":"ETH_USDT"}]
*/

//@version=6
strategy("Donchian Trend Ribbon Strategy", shorttitle="DonchianTrendRibbonStrat", overlay=true, precision=0)

//~~~~~~~~~~~~~~~~~~~~~~~~~~~~~~~~~~~~~~~~~~~~~~~~~~~~~~~~~~~~~~~~~~~~~~~~~~~~~~- 1