
ওভারভিউ
এই কৌশলটি একটি ট্রেডিং ভলিউম এবং দামের পরিবর্তনের উপর ভিত্তি করে একটি ট্রেন্ড ট্র্যাকিং সিস্টেম, যা নেট ট্র্যাফিক ভলিউম স্ট্রাইক সূচক (NVO) গণনা করে বাজারের গতিপথের পূর্বাভাস দেয়। কৌশলটি একাধিক মুভিং এভারেজ টাইপ (EMA, WMA, SMA, HMA) এর সাথে স্ট্রাইক সূচকটির অবস্থানগত সম্পর্কের তুলনা করে বাজারের প্রবণতা নির্ধারণ করে এবং উপযুক্ত সময়ে বাণিজ্য করে। কৌশলটি ঝুঁকি নিয়ন্ত্রণ এবং মুনাফা লক করার জন্য স্টপ লস এবং স্টপ স্টপ মেশিনও অন্তর্ভুক্ত করে।
কৌশল নীতি
কৌশলটির মূল বিষয় হল প্রতিদিনের নিট লেনদেনের পরিমাণের অস্থিরতার মান গণনা করে বাজারের মনোভাব নির্ধারণ করা। নিম্নলিখিত পদক্ষেপগুলি গণনা করা হয়ঃ
- দামের ব্যাপ্তি গণনা করুনঃ দিনের সর্বোচ্চ, সর্বনিম্ন এবং সমাপ্তির মূল্যের উপর ভিত্তি করে 0 থেকে 1 এর মধ্যে একটি গুণক গণনা করুন
- কার্যকরভাবে বৃদ্ধি এবং হ্রাস লেনদেনের পরিমাণ গণনা করুনঃ লেনদেনের পরিমাণে দামের পরিবর্তনের দিক এবং গুণকের উপর নির্ভর করে ওজন দিন
- নিট লেনদেন গণনা করুনঃ লেনদেনের কার্যকর উত্থানকে লেনদেনের কার্যকর পতন থেকে বিয়োগ করুন
- অ্যাপ্লিকেশন-নির্বাচিত চলমান গড়ঃ নেট লেনদেনের পরিসংখ্যানকে মসৃণ করা
- ইএমএ সারিবদ্ধকরণের গণনাঃ প্রবণতা নির্ধারণের জন্য একটি রেফারেন্স লাইন
- পরিবর্তনের হার গণনা করুন (ROC): প্রবণতা শক্তির পরিবর্তনের বিচার করতে ব্যবহৃত হয়
ট্রেডিং সিগন্যালের উৎপত্তি নিম্নলিখিত নিয়মের উপর ভিত্তি করেঃ
- একাধিক শর্তঃ কম্পন সূচকের উপর EMA স্ট্রিং পরুন
- শূন্যতার শর্তঃ কম্পন সূচকের অধীনে ইএমএ স্তরিত লাইনটি অতিক্রম করুন
- স্টপ লসঃ শতাংশ ভিত্তিক মূল্য স্টপ লস
- স্টপেজ: শতাংশের ভিত্তিতে মূল্য স্টপেজ
কৌশলগত সুবিধা
- মাল্টি-ডাইমেনশনাল অ্যানালিসিসঃ মূল্য, লেনদেনের পরিমাণ এবং প্রবণতা পরিবর্তনের হারকে একত্রিত করে বাজার তথ্য
- উচ্চ স্থিতিস্থাপকতাঃ বিভিন্ন বাজারের বৈশিষ্ট্য অনুসারে সামঞ্জস্যপূর্ণ একাধিক চলমান গড় প্রকারের সমর্থন
- ঝুঁকি ব্যবস্থাপনা উন্নতঃ ঝুঁকি কার্যকরভাবে নিয়ন্ত্রণ করার জন্য একটি ক্ষতি প্রতিরোধ ব্যবস্থা অন্তর্ভুক্ত
- শক্তিশালী ভিজ্যুয়ালাইজেশনঃ প্রবণতা শক্তির পরিবর্তনগুলি দেখানোর জন্য একটি ডায়াগ্রাম ব্যবহার করে, যা বাজারের অবস্থা বুঝতে সহায়তা করে
- অভিযোজনযোগ্যতাঃ প্যারামিটারাইজড ডিজাইনের মাধ্যমে বিভিন্ন বাজার পরিবেশ এবং লেনদেনের জাতের সাথে খাপ খাইয়ে নেওয়া যায়
কৌশলগত ঝুঁকি
- ট্রেন্ড রিভার্সনের ঝুঁকিঃ বাজারে ঘন ঘন ভুল সংকেত দেখা দিতে পারে
- পিছিয়ে পড়ার ঝুঁকিঃ মুভিং এভারেজ নিজেই কিছুটা পিছিয়ে পড়ে, যার ফলে প্রবেশ এবং প্রস্থানের সময়টি অনুকূল নয়
- পরামিতি সংবেদনশীলতা: বিভিন্ন পরামিতি সমন্বয় কৌশল কর্মক্ষমতা বড় পার্থক্য হতে পারে
- বাজার পরিবেশের উপর নির্ভরশীলতাঃ কিছু বাজার পরিবেশের অধীনে দুর্বল হতে পারে
- প্রযুক্তিগত সীমাবদ্ধতাঃ শুধুমাত্র প্রযুক্তিগত সূচকগুলির উপর নির্ভর করে, মৌলিক বিষয়গুলি বিবেচনা করে না
ঝুঁকি নিয়ন্ত্রণের পরামর্শ:
- বিভিন্ন বাজারের পরিস্থিতিতে প্যারামিটার অপ্টিমাইজেশনের পরামর্শ
- অন্যান্য প্রযুক্তিগত সূচকগুলির সাথে সংযুক্ত সংকেত নিশ্চিতকরণ
- বিভিন্ন বাজারের অস্থিরতার সাথে সামঞ্জস্য রেখে স্টপ-অফ-স্টপ প্যারামিটারগুলি যথাযথভাবে সামঞ্জস্য করুন
কৌশল অপ্টিমাইজেশনের দিকনির্দেশনা
-
সিগন্যাল কনফার্মেশন মেকানিজম অপ্টিমাইজ করা হয়েছেঃ
- যোগ করা হয়েছে
- প্রবণতা শক্তি ফিল্টার যোগ করুন
- উদ্বায়ীতা অভিযোজিত প্রক্রিয়া প্রবর্তন
-
ঝুঁকি ব্যবস্থাপনা অপ্টিমাইজেশান:
- গতিশীল স্টপ লস মেকানিজম প্রয়োগ করুন
- একটি তহবিল ব্যবস্থাপনা মডিউল যোগ করুন
- স্টক বিল্ডিং এবং স্টক হ্রাস প্রক্রিয়া প্রবর্তন
-
প্যারামিটার অপ্টিমাইজেশানঃ
- একটি স্বনির্ধারিত প্যারামিটার সমন্বয় প্রক্রিয়া বিকাশ
- বাজারের উপর ভিত্তি করে প্যারামিটার স্যুইচিং
- প্যারামিটার অপ্টিমাইজেশনের জন্য মেশিন লার্নিং মডেল যোগ করুন
সারসংক্ষেপ
এই কৌশলটি একটি সম্পূর্ণ ট্রেডিং সিস্টেম তৈরি করে যা ট্রেডিং ভলিউম এবং দামের ডেটা বিশ্লেষণ করে। কৌশলটির প্রধান বৈশিষ্ট্য হ'ল এটি একাধিক প্রযুক্তিগত সূচককে একত্রিত করে এবং এটি নমনীয় প্যারামিটার কনফিগারেশন বিকল্প সরবরাহ করে। যদিও কিছু ঝুঁকি রয়েছে, তবে যুক্তিসঙ্গত ঝুঁকি নিয়ন্ত্রণ এবং ক্রমাগত অপ্টিমাইজেশনের মাধ্যমে কৌশলটি বাস্তব ব্যবসায়ের ক্ষেত্রে স্থিতিশীল উপার্জনের প্রত্যাশিত। ব্যবসায়ীদের রিয়েল-টাইমে ব্যবহারের আগে পর্যাপ্ত ফিডব্যাক করার পরামর্শ দেওয়া হয় এবং নির্দিষ্ট বাজারের পরিস্থিতি অনুসারে প্যারামিটারগুলি যথাযথভাবে সামঞ্জস্য করা হয়।
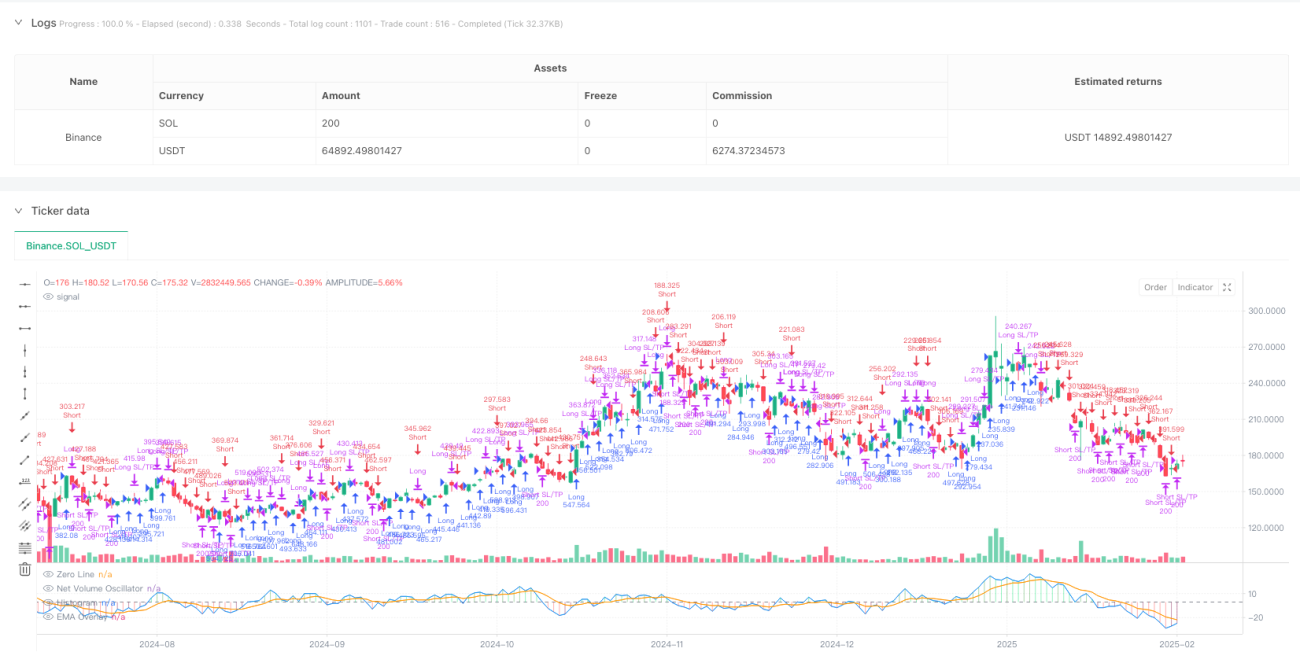
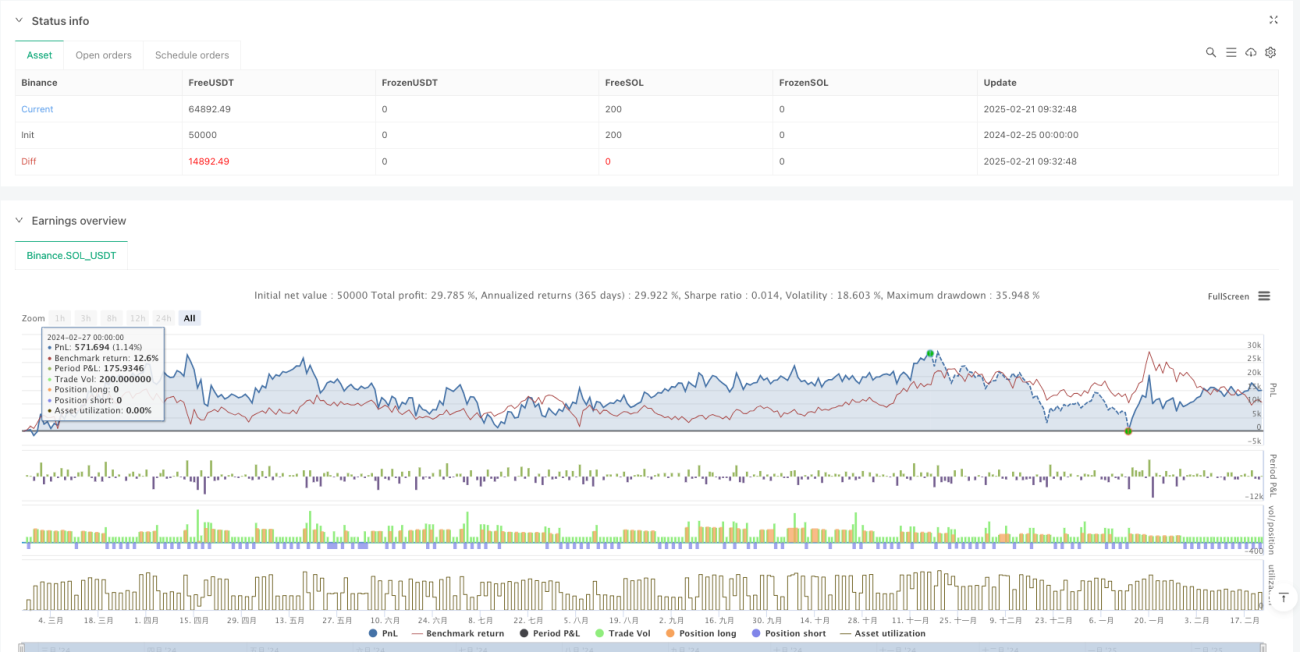
/*backtest
start: 2024-02-25 00:00:00
end: 2025-02-22 08:00:00
period: 1d
basePeriod: 1d
exchanges: [{"eid":"Binance","currency":"SOL_USDT"}]
*/

//@version=5
strategy("EMA-Based Net Volume Oscillator with Trend Change", shorttitle="NVO Trend Change", overlay=false, initial_capital=100000, default_qty_type=strategy.percent_of_equity, default_qty_value=100)

// Input parameters- 1