
সারসংক্ষেপ
মাল্টি-ডাইমেনশনাল পিভট পয়েন্ট ট্রেডিং স্ট্র্যাটেজি এবং ডাইনামিক ফিবোনাচি ইন্ডিকেটর সিস্টেম একটি প্রযুক্তিগত বিশ্লেষণ-ভিত্তিক ট্রেডিং কৌশল যা মূলত ইন্ট্রাডে পিভট পয়েন্ট, সেন্ট্রাল পিভট রেঞ্জ (CPR), ফিবোনাচি রিট্রেসমেন্ট লেভেল, ভলিউম ওয়েটেড এভারেজ প্রাইস (VWAP) এবং মুভিং এভারেজের মতো একাধিক সূচক ব্যবহার করে সম্ভাব্য ক্রয় ও বিক্রয়ের সুযোগ চিহ্নিত করে। এই কৌশলটি ইন্ট্রাডে ট্রেডারদের জন্য উপযুক্ত, বিশেষ করে ৩ মিনিটের ক্যান্ডেলস্টিক চার্টের স্বল্পমেয়াদী ট্রেডিংয়ের জন্য। কৌশলটির মূল বিষয় হল নির্দিষ্ট শর্ত পূরণকারী ক্যান্ডেল কী-সাপোর্ট ও রেজিস্ট্যান্স লেভেল স্পর্শ করে কিনা তা নির্ধারণ করা, যার ফলে ট্রেডিং সিগন্যাল তৈরি হয়।
এই কৌশলটি দৈনিক উচ্চ, নিম্ন এবং ক্লোজিং প্রাইস ব্যবহার করে গণনা করা পিভট পয়েন্ট সিস্টেম ব্যবহার করে, যার সাথে ভলিউম ওয়েটেড এভারেজ প্রাইস (VWAP) এবং মুভিং VWAP (MVWAP) গতিশীল সাপোর্ট ও রেজিস্ট্যান্স রেফারেন্স হিসেবে কাজ করে। একই সাথে, রিলেটিভ স্ট্রেংথ ইনডেক্স (RSI), সিম্পল মুভিং এভারেজ (SMA) এবং এক্সপোনেনশিয়াল মুভিং এভারেজ (EMA)-এর মতো প্রযুক্তিগত সূচক ব্যবহার করে একটি সম্পূর্ণ ট্রেডিং সিদ্ধান্ত ব্যবস্থা তৈরি করা হয়েছে।
কৌশলটি প্রথমে যোগ্যতা সম্পন্ন সবুজ (বুলিশ) এবং লাল (বেয়ারিশ) ক্যান্ডেল চিহ্নিত করে, তারপর এই ক্যান্ডেলগুলি পিভট পয়েন্ট, সাপোর্ট, রেজিস্ট্যান্স বা VWAP-এর মতো মূল মূল্যের স্তর স্পর্শ করেছে কিনা তা যাচাই করে। যখন একটি লাল ক্যান্ডেল একটি গুরুত্বপূর্ণ মূল্যের স্তর স্পর্শ করে, তখন একটি ক্রয় সিগন্যাল (CE) তৈরি হয়; যখন একটি সবুজ ক্যান্ডেল একটি গুরুত্বপূর্ণ মূল্যের স্তর স্পর্শ করে, তখন একটি বিক্রয় সিগন্যাল (PE) তৈরি হয়। এই বিপরীতমুখী ধারণাটি গুরুত্বপূর্ণ মূল্যের স্তরে সম্ভাব্য রিভার্সাল পয়েন্ট খোঁজার মূল নীতিকে প্রতিফলিত করে।
কৌশলের নীতি
এই কৌশলটির নীতিটি মূল সাপোর্ট ও রেজিস্ট্যান্স স্তরের চারপাশে মূল্যের ওঠানামার বাজারের আচরণের উপর ভিত্তি করে তৈরি, যার সাথে ক্যান্ডেল প্যাটার্ন, ভলিউম এবং মোমেন্টাম সূচক ব্যবহার করে ট্রেডিং সিদ্ধান্ত নেওয়া হয়। নির্দিষ্ট নীতির ব্যাখ্যা নিম্নরূপ:
-
ক্যান্ডেল শনাক্তকরণ প্রক্রিয়া:
- সবুজ ক্যান্ডেল (বুলিশ): ক্লোজিং প্রাইস ওপেনিং প্রাইসের চেয়ে বেশি, ক্যান্ডেলের বডির উচ্চতা কমপক্ষে ১৭ পিপ, ওপেনিং প্রাইস লো প্লাস ০.৩৮২ গুণ ক্যান্ডেল রেঞ্জের চেয়ে কম, ক্লোজিং প্রাইস লো প্লাস ০.৬৮২ গুণ ক্যান্ডেল রেঞ্জের চেয়ে বেশি।
- লাল ক্যান্ডেল (বেয়ারিশ): ক্লোজিং প্রাইস ওপেনিং প্রাইসের চেয়ে কম, ক্যান্ডেলের বডির উচ্চতা কমপক্ষে ১৭ পিপ।
-
পিভট পয়েন্ট গণনা পদ্ধতি:
- ডেইলি পিভট পয়েন্ট (PP): (দৈনিক উচ্চ + দৈনিক নিম্ন + দৈনিক ক্লোজ) / ৩
- রেজিস্ট্যান্স লেভেল: R1, R2, R3, R4
- সাপোর্ট লেভেল: S1, S2, S3, S4
- সেন্ট্রাল পিভট রেঞ্জ (CPR): বটম CPR এবং টপ CPR নিয়ে গঠিত, যা বাজারের সম্ভাব্য কনসলিডেশন জোন নির্দেশ করে।
-
মূল্যের গতিশীল রেফারেন্স:
- VWAP (ভলিউম ওয়েটেড এভারেজ প্রাইস): ভলিউম ফ্যাক্টর বিবেচনায় নিয়ে গড় মূল্যের স্তর প্রতিফলিত করে।
- MVWAP (মুভিং VWAP): VWAP-এর মুভিং এভারেজ, যা একটি মসৃণ মূল্যের রেফারেন্স প্রদান করে।
-
সহায়ক সূচক সিস্টেম:
- RSI: বাজারের ওভারবট/ওভারসেল অবস্থা পরিমাপ করতে ব্যবহৃত হয়।
- SMA (৫০ পিরিয়ড) এবং EMA (২০ পিরিয়ড): মূল্যের ট্রেন্ড দিকনির্দেশনার রেফারেন্স প্রদান করে।
- ভলিউম বিশ্লেষণ: ২০ পিরিয়ডের ভলিউম মুভিং এভারেজের মাধ্যমে ভলিউম ট্রেন্ড মূল্যায়ন করা হয়।
-
ট্রেডিং সিগন্যাল জেনারেশন:
- যখন একটি যোগ্য লাল ক্যান্ডেল যেকোনো পিভট পয়েন্ট, সাপোর্ট, রেজিস্ট্যান্স বা VWAP/MVWAP স্পর্শ করে, তখন একটি ক্রয় সিগন্যাল (CE) তৈরি হয়।
- যখন একটি যোগ্য সবুজ ক্যান্ডেল যেকোনো পিভট পয়েন্ট, সাপোর্ট, রেজিস্ট্যান্স বা VWAP/MVWAP স্পর্শ করে, তখন একটি বিক্রয় সিগন্যাল (PE) তৈরি হয়।
কৌশলটির মূল ধারণা হল মূল সাপোর্ট ও রেজিস্ট্যান্স স্তরের কাছাকাছি মূল্যের সম্ভাব্য রিভার্সাল ক্যাপচার করা, নির্দিষ্ট ক্যান্ডেল প্যাটার্ন এবং একাধিক প্রযুক্তিগত সূচক ফিল্টারের মাধ্যমে সিগন্যালের কার্যকারিতা বৃদ্ধি করা। পিভট পয়েন্ট স্পর্শকারী ক্যান্ডেল সাধারণত বোঝায় যে বাজার এই গুরুত্বপূর্ণ মূল্যের স্তরে দ্বিধা বা রিভার্সালের সম্ভাবনা বৃদ্ধি পেয়েছে।
কৌশলের সুবিধা
এই কৌশল কোডটি গভীরভাবে বিশ্লেষণ করলে নিম্নলিখিত উল্লেখযোগ্য সুবিধাগুলি চিহ্নিত করা যায়:
-
বহুমাত্রিক যাচাইকরণ প্রক্রিয়া: একাধিক প্রযুক্তিগত সূচক (পিভট পয়েন্ট, VWAP, মুভিং এভারেজ, RSI) একত্রিত করে ট্রেডিং সিগন্যাল যাচাই করে, যার ফলে ভুয়া সিগন্যালের ঝুঁকি হ্রাস পায়।
-
বাজারের সাথে গতিশীল অভিযোজন: ইন্ট্রাডে পিভট পয়েন্ট সিস্টেম প্রতিদিন আপডেট হয়, যা কৌশলটিকে বিভিন্ন বাজার পরিবেশ এবং অস্থিরতার সাথে খাপ খাইয়ে নিতে সক্ষম করে।
-
সঠিক ক্যান্ডেল শনাক্তকরণ: কঠোর ক্যান্ডেল প্যাটার্ন শর্ত এবং ফিবোনাচি স্তরের মাধ্যমে সম্ভাব্য ট্রেডিং সুযোগগুলি ফিল্টার করে সিগন্যালের গুণগত মান উন্নত করে।
-
নমনীয় প্রদর্শন সেটিংস: কৌশলটিতে ভিউ অ্যাডাপ্টিভ ফিচার রয়েছে, যা শুধুমাত্র উপযুক্ত সময় ফ্রেমে (১৫ মিনিটের নিচের ইন্ট্রাডে চার্ট) পিভট পয়েন্ট প্রদর্শন করে, চার্টের জটিলতা কমায়।
-
বিপরীতমুখী চিন্তার সুবিধা: কৌশলটি লাল ক্যান্ডেল গুরুত্বপূর্ণ স্তর স্পর্শ করলে ক্রয়ের সুযোগ এবং সবুজ ক্যান্ডেল গুরুত্বপূর্ণ স্তর স্পর্শ করলে বিক্রয়ের সুযোগ খোঁজে, যা বাজারের সম্ভাব্য স্বল্পমেয়াদী ওভারবট/ওভারসেল অবস্থার সুযোগ নেয়।
-
সম্পূর্ণ মূল্য স্তর ব্যবস্থা: একাধিক স্তরের সাপোর্ট ও রেজিস্ট্যান্স (S1-S4 এবং R1-R4) অন্তর্ভুক্ত, যা বিভিন্ন অস্থিরতার বাজার পরিবেশের জন্য উপযুক্ত সমৃদ্ধ রেফারেন্স মূল্য প্রদান করে।
-
সেন্ট্রাল পিভট রেঞ্জ (CPR) এর একীকরণ: CPR দিনের সম্ভাব্য কনসলিডেশন জোন চিহ্নিত করতে সাহায্য করে, যা ইন্ট্রাডে ট্রেডিংয়ে গুরুত্বপূর্ণ রেফারেন্স মান রাখে।
-
ভিজ্যুয়াল সহায়তা: প্রচুর মার্কার এবং শেপ ডিসপ্লের মাধ্যমে, চার্টে যোগ্য ক্যান্ডেল এবং গুরুত্বপূর্ণ মূল্য স্পর্শের ঘটনা দৃশ্যমানভাবে চিহ্নিত করা যায়, যা ট্রেডারদের দ্রুত শনাক্ত করতে সাহায্য করে।
-
ভলিউম নিশ্চিতকরণ: ভলিউম বিশ্লেষণ যুক্ত করে, ভলিউম মুভিং এভারেজের মাধ্যমে বাজারের অংশগ্রহণ মূল্যায়ন করে সিগন্যালের নির্ভরযোগ্যতা বৃদ্ধি করে।
-
ইন্ট্রাডে ট্রেডিংয়ের জন্য উপযুক্ত: কৌশলটি বিশেষভাবে স্বল্প সময় ফ্রেমের (বিশেষ করে ৩ মিনিটের চার্ট) জন্য ডিজাইন করা হয়েছে, যা ইন্ট্রাডে ট্রেডারদের বাজারের ওঠানামা ব্যবহার করে ঘন ঘন ট্রেড করতে সহায়তা করে।
উপরোক্ত সুবিধাগুলি এই কৌশলটিকে একটি ব্যাপক, অভিযোজনযোগ্য ইন্ট্রাডে ট্রেডিং সিস্টেমে পরিণত করে, বিশেষ করে প্রযুক্তিগত বিশ্লেষণ সম্পর্কে কিছু ধারণা রাখা এবং মূল্যের আচরণ ও গুরুত্বপূর্ণ মূল্য স্তরের উপর ভিত্তি করে ট্রেড করতে ইচ্ছুক বিনিয়োগকারীদের জন্য উপযুক্ত।
কৌশলের ঝুঁকি
যদিও এই কৌশলটির একাধিক সুবিধা রয়েছে, তবুও কিছু সম্ভাব্য ঝুঁকি রয়েছে যা ট্রেডারদের সতর্কতার সাথে মোকাবেলা করতে হবে:
-
অতিরিক্ত সিগন্যালের ঝুঁকি: যেহেতু কৌশলটিতে একাধিক পিভট পয়েন্ট (PP, R1-R4, S1-S4) এবং অন্যান্য সূচক জড়িত, অস্থির বাজারে অতিরিক্ত সিগন্যাল তৈরি হতে পারে, যার ফলে ঘন ঘন ট্রেডিং এবং কমিশন খরচ বৃদ্ধি পেতে পারে।
- সমাধান: ট্রেডিং সেশন সীমাবদ্ধতা বা ট্রেন্ড নিশ্চিতকরণ শর্তের মতো অতিরিক্ত ফিল্টার যোগ করার কথা বিবেচনা করা যেতে পারে।
-
বিপরীতমুখী ট্রেডিং ফাঁদ: কৌশলটি বিপরীতমুখী যুক্তির উপর ভিত্তি করে (লাল ক্যান্ডেল গুরুত্বপূর্ণ স্তর স্পর্শ করলে ক্রয়, সবুজ ক্যান্ডেল গুরুত্বপূর্ণ স্তর স্পর্শ করলে বিক্রয়), যা শক্তিশালী ট্রেন্ড বাজারে ধারাবাহিক লোকসানের কারণ হতে পারে।
- সমাধান: কৌশল ব্যবহারের আগে সামগ্রিক বাজার ট্রেন্ড মূল্যায়ন করা, শক্তিশালী ট্রেন্ডে বিপরীত ট্রেডিং এড়াতে ট্রেন্ড ফিল্টার যোগ করা যেতে পারে।
-
প্যারামিটার সংবেদনশীলতা: কৌশলের কার্যকারিতা ক্যান্ডেল শনাক্তকরণ প্যারামিটার (যেমন ক্যান্ডেলের উচ্চতা ১৭ পিপের বেশি হতে হবে) এবং মুভিং এভারেজ পিরিয়ড সেটিংসের উপর অত্যন্ত নির্ভরশীল, বিভিন্ন বাজার পরিবেশের জন্য বিভিন্ন প্যারামিটারের প্রয়োজন হতে পারে।
- সমাধান: বিভিন্ন পণ্য ও বাজার অবস্থার জন্য ব্যাকটেস্টিং করে প্যারামিটার অপ্টিমাইজ করা।
-
স্টপ-লস মেকানিজমের অভাব: কোডে স্পষ্টভাবে স্টপ-লস কৌশল নির্ধারণ করা হয়নি, যার ফলে একক ট্রেডে অতিরিক্ত লোকসান হতে পারে।
- সমাধান: ATR-ভিত্তিক ডাইনামিক স্টপ-লস বা নির্দিষ্ট পিপ স্টপ-লসের মতো স্পষ্ট স্টপ-লস কৌশল বাস্তবায়ন করা।
-
ইন্ট্রাডে কৌশলের সীমাবদ্ধতা: ৩ মিনিটের চার্টে মনোনিবেশ করা ইন্ট্রাডে কৌশল হিসাবে, এটি মধ্যম ও দীর্ঘমেয়াদী ধারণের জন্য উপযুক্ত নয় এবং সম্ভাব্য দীর্ঘমেয়াদী ট্রেন্ডের সুযোগ হারাতে পারে।
- সমাধান: এই কৌশলটিকে ট্রেডিং সিস্টেমের একটি অংশ হিসাবে বিবেচনা করে মধ্যম ও দীর্ঘমেয়াদী কৌশলের সাথে ব্যবহার করা।
-
পিভট পয়েন্টের সীমাবদ্ধতা: রেঞ্জ-বাউন্ড বাজারে, মূল্য ঘন ঘন একাধিক পিভট পয়েন্ট স্পর্শ করতে পারে, যা বিভ্রান্তিকর সিগন্যাল তৈরি করতে পারে।
- সমাধান: কনসলিডেশন বাজারে সাময়িকভাবে কৌশল বন্ধ করা বা সিগন্যাল নিশ্চিতকরণ শর্ত যোগ করা।
-
ভলিউম ওয়েট অ্যাডজাস্টমেন্টের অভাব: যদিও VWAP ব্যবহার করা হয়েছে, কৌশলটি ভলিউমের আকার অনুযায়ী সিগন্যালের ওজন গতিশীলভাবে সমন্বয় করে না।
- সমাধান: ভলিউম থ্রেশহোল্ড শর্ত যোগ করা, যাতে যথেষ্ট বাজার অংশগ্রহণের শর্তে ট্রেড নিশ্চিত করা যায়।
-
সময় নির্ভরশীলতা: দৈনিক পিভট পয়েন্ট পূর্ববর্তী দিনের ডেটার উপর ভিত্তি করে, নতুন ট্রেডিং দিন শুরুতে পর্যাপ্ত ডেটার অভাবে অস্থির আচরণ করতে পারে।
- সমাধান: ট্রেডিং দিন শুরু হওয়ার ৩০-৬০ মিনিট পর কৌশল চালু করার বিষয়ে বিবেচনা করা, যাতে যথেষ্ট বাজার তথ্য পাওয়া যায়।
-
অটোমেশন বাস্তবায়নের চ্যালেঞ্জ: কৌশলটিতে একাধিক শর্ত বিচার জড়িত, প্রকৃত অটোমেটেড এক্সিকিউশনে বিলম্ব বা সময়মতো এক্সিকিউশনে সমস্যা হতে পারে।
- সমাধান: এক্সিকিউশন সিস্টেম অপ্টিমাইজ করে লো লেটেন্সি নিশ্চিত করা, বা আধা-স্বয়ংক্রিয় পদ্ধতিতে মানব নিশ্চিতকরণের সাথে ব্যবহার করা।
-
ব্যাকটেস্টিং পক্ষপাতের ঝুঁকি: কোডে সবুজ/লাল ক্যান্ডেল শনাক্তকরণের যুক্তি ব্যাকটেস্টিং এবং লাইভ পরিবেশে ভিন্নভাবে আচরণ করতে পারে।
- সমাধান: কঠোর ডেমো টেস্টিং পরিচালনা করা, নিশ্চিত করা যে কৌশলটি প্রকৃত ট্রেডিং পরিবেশেও কার্যকর।
এই ঝুঁকিগুলি চিহ্নিত করা এবং পরিচালনা করা এই কৌশলটির সফল প্রয়োগের জন্য অত্যন্ত গুরুত্বপূর্ণ। ট্রেডারদের নিজস্ব ঝুঁকি সহনশীলতা এবং ট্রেডিং অভ্যাস অনুযায়ী যথাযথ সমন্বয় করা উচিত।
কৌশল অপ্টিমাইজেশনের দিকনির্দেশ
কোডের গভীর বিশ্লেষণের ভিত্তিতে, নিম্নলিখিত মূল অপ্টিমাইজেশন দিকনির্দেশগুলি চিহ্নিত করা যায়:
-
গতিশীল ক্যান্ডেল শনাক্তকরণ প্যারামিটার:
- বর্তমান কৌশলটি কার্যকর ক্যান্ডেল শনাক্ত করতে নির্দিষ্ট মান ব্যবহার করে (যেমন ক্যান্ডেলের উচ্চতা কমপক্ষে ১৭ পিপ), যা ATR (গড় সত্য পরিসর)-ভিত্তিক গতিশীল প্যারামিটারে পরিবর্তন করা যেতে পারে, যাতে কৌশলটি বিভিন্ন অস্থিরতার পরিবেশের সাথে ভালভাবে খাপ খাইয়ে নিতে পারে।
- অপ্টিমাইজেশনের কারণ: নির্দিষ্ট প্যারামিটার বিভিন্ন অস্থিরতার পরিবেশে ভিন্ন ফলাফল দেয়, গতিশীল প্যারামিটার কৌশলের অভিযোজন ক্ষমতা বাড়ায়।
-
ট্রেন্ড ফিল্টারিং সিস্টেম:
- উচ্চতর সময় ফ্রেমের (যেমন ১৫ মিনিট বা ৩০ মিনিট) ট্রেন্ড নির্ধারণ যোগ করা, শুধুমাত্র প্রধান ট্রেন্ডের দিকেই ট্রেড করা বা সিগন্যালের ওজন সমন্বয় করা।
- অপ্টিমাইজেশনের কারণ: শক্তিশালী ট্রেন্ডে ঘন ঘন বিপরীত ট্রেডিং এড়ানো, জয়ের হার এবং ঝুঁকি-প্রত্যাশার অনুপাত উন্নত করা।
-
সিগন্যাল গুণমান স্কোরিং মেকানিজম:
- প্রতিটি ট্রেডিং সিগন্যালের জন্য একটি সমন্বিত স্কোরিং সিস্টেম তৈরি করা, যা একাধিক বিষয় বিবেচনা করে: ক্যান্ডেলের শক্তি, স্পর্শ করা পিভট পয়েন্টের গুরুত্ব, RSI মান, ভলিউম অস্বাভাবিকতা ইত্যাদি।
- অপ্টিমাইজেশনের কারণ: সব সিগন্যালের গুণমান সমান নয়, স্কোরিং সিস্টেম নিম্নমানের সিগন্যাল ফিল্টার করে ট্রেডিং দক্ষতা বাড়াতে পারে।
-
মানি ম্যানেজমেন্ট ইন্টিগ্রেশন:
- সিগন্যালের শক্তি এবং বাজার অবস্থার ভিত্তিতে পজিশনের আকার গতিশীলভাবে সমন্বয় করা, উচ্চ সম্ভাবনার সুযোগে পজিশন বাড়ানো এবং কম সম্ভাবনায় ঝুঁকি কমানো।
- অপ্টিমাইজেশনের কারণ: কার্যকর মানি ম্যানেজমেন্ট দীর্ঘমেয়াদী লাভের জন্য অত্যন্ত গুরুত্বপূর্ণ, যা কৌশলের কর্মক্ষমতা উল্লেখযোগ্যভাবে উন্নত করতে পারে।
-
মাল্টি-টাইমফ্রেম নিশ্চিতকরণ:
- সিগন্যাল জেনারেশনের আগে একাধিক সময় ফ্রেমের শর্তের ধারাবাহিকতা পরীক্ষা করা, যেমন ৩ মিনিট এবং ১৫ মিনিটের চার্টের সিগন্যাল মিলে গেলে ট্রেড করা।
- অপ্টিমাইজেশনের কারণ: মাল্টি-টাইমফ্রেম নিশ্চিতকরণ ভুয়া সিগন্যালের সম্ভাবনা কমাতে পারে এবং ট্রেডিং নির্ভুলতা বাড়াতে পারে।
-
স্টপ-লস এবং টেক-প্রফিট মেকানিজম:
- বুদ্ধিমান স্টপ-লস সিস্টেম বাস্তবায়ন, যেমন অস্থিরতা-ভিত্তিক গতিশীল স্টপ-লস বা কী স্ট্রাকচারাল লেভেল স্টপ-লস, একই সাথে স্বয়ংক্রিয় টেক-প্রফিট লক্ষ্য নির্ধারণ করা।
- অপ্টিমাইজেশনের কারণ: সম্পূর্ণ ঝুঁকি ব্যবস্থাপনা বড় ড্রডাউন এড়ানো এবং মুনাফা রক্ষার জন্য অত্যন্ত গুরুত্বপূর্ণ।
-
ট্রেডিং সময় ফিল্টার:
- কার্যকর এবং অকার্যকর ট্রেডিং সময় চিহ্নিত করা, কম অস্থিরতা বা বিশৃঙ্খল সময় (যেমন লাঞ্চ টাইম বা বাজার খোলা ও বন্ধের সময়) এড়ানো।
- অপ্টিমাইজেশনের কারণ: বিভিন্ন সময়ে বাজারের আচরণ ভিন্ন হয়, নির্বাচনী ট্রেডিং সামগ্রিক দক্ষতা বাড়াতে পারে।
-
অভিযোজিত সূচক প্যারামিটার:
- নির্দিষ্ট প্রযুক্তিগত সূচক প্যারামিটার (যেমন RSI-এর ১৪ পিরিয়ড, EMA-এর ২০ পিরিয়ড) বাজারের অবস্থার উপর ভিত্তি করে স্বয়ংক্রিয়ভাবে সমন্বয়যোগ্য প্যারামিটারে পরিবর্তন করা।
- অপ্টিমাইজেশনের কারণ: বাজারের অবস্থা পরিবর্তিত হলে সর্বোত্তম সূচক প্যারামিটারও পরিবর্তিত হওয়া উচিত, যা সূচকের সংবেদনশীলতা বাড়ায়।
-
বাজার পরিবেশ শ্রেণীবিভাগ:
- বর্তমান বাজার পরিবেশ (ট্রেন্ড, রেঞ্জ, উচ্চ অস্থিরতা ইত্যাদি) স্বয়ংক্রিয়ভাবে চিহ্নিত করার অ্যালগরিদম যোগ করা এবং বিভিন্ন পরিবেশের জন্য বিভিন্ন প্যারামিটার সেটিংস প্রয়োগ করা।
- অপ্টিমাইজেশনের কারণ: একক প্যারামিটার সেটিংস সব বাজার পরিবেশে সেরা ফলাফল দিতে পারে না, পরিবেশ-অভিযোজিত সমন্বয় কৌশলের স্থিতিশীলতা উল্লেখযোগ্যভাবে উন্নত করতে পারে।
-
মেশিন লার্নিং বর্ধন:
- ঐতিহাসিক প্যাটার্ন শনাক্তকরণের ভিত্তিতে ট্রেডিং সিগন্যালের সাফল্যের সম্ভাবনা পূর্বাভাস দেওয়ার জন্য মেশিন লার্নিং মডেল একীভূত করার বিবেচনা করুন, এবং সেই অনুযায়ী সিগন্যাল ফিল্টার ও অগ্রাধিকার নির্ধারণ করুন।
- অপ্টিমাইজেশনের যুক্তি: মেশিন লার্নিং মানব-চোখে দেখা কঠিন এমন জটিল প্যাটার্ন আবিষ্কার করতে পারে, যা কৌশলটির বুদ্ধিমত্তার স্তর বাড়ায়।
উপরের অপ্টিমাইজেশন দিকগুলি বাস্তবায়নের মাধ্যমে, এই কৌশলটি তার মূল শক্তি বজায় রেখে অভিযোজন ক্ষমতা, নির্ভুলতা এবং দীর্ঘমেয়াদী লাভজনকতা উল্লেখযোগ্যভাবে উন্নত করতে পারে এবং বিভিন্ন বাজার অবস্থার চ্যালেঞ্জ মোকাবেলায় আরও ভালভাবে সক্ষম হবে।
সারসংক্ষেপ
মাল্টি-ডাইমেনশনাল পিভট পয়েন্ট ট্রেডিং কৌশল এবং ডায়নামিক ফিবোনাচি ইন্ডিকেটর সিস্টেম একটি ব্যাপক ও সুসংহত ইন্ট্রাডে ট্রেডিং কৌশল সিস্টেম। এটি দক্ষতার সাথে ঐতিহ্যবাহী টেকনিক্যাল অ্যানালাইসিস টুলস (পিভট পয়েন্ট, ফিবোনাচি রিট্রেসমেন্ট, মুভিং এভারেজ) এবং আধুনিক ডায়নামিক ইন্ডিকেটর (VWAP, CPR) একত্রিত করে। কঠোর ক্যান্ডেল শর্ত এবং মাল্টিপল ইন্ডিকেটর নিশ্চিতকরণের মাধ্যমে, এটি ট্রেডারদের জন্য একটি সম্ভাবনাময় ইন্ট্রাডে ট্রেডিং ফ্রেমওয়ার্ক সরবরাহ করে।
এই কৌশলের মূল শক্তি হলো মূল্য স্তরগুলির ব্যাপক কভারেজ এবং সম্ভাব্য রিভার্সাল পয়েন্টের প্রতি সংবেদনশীল ক্যাপচার। কঠোর ক্যান্ডেল শনাক্তকরণ শর্ত সেট করার মাধ্যমে, কৌশলটি বাজারের প্রচুর অর্থহীন শব্দ ফিল্টার করে উচ্চ-সম্ভাবনার ট্রেডিং সুযোগের উপর ফোকাস করে। একইসাথে, ভলিউম এবং মোমেন্টাম ইন্ডিকেটরের ব্যবহার সিগন্যালের নির্ভরযোগ্যতাকে আরও শক্তিশালী করে।
তবে, কৌশলটির কিছু সীমাবদ্ধতাও রয়েছে, যেমন অতিরিক্ত সিগন্যাল, বিপরীত ট্রেডের ঝুঁকি এবং প্যারামিটার অপ্টিমাইজেশনের চ্যালেঞ্জ। এই সমস্যাগুলির সমাধানে আমরা একাধিক অপ্টিমাইজেশনের দিক প্রস্তাব করেছি, যার মধ্যে রয়েছে ডায়নামিক প্যারামিটার অ্যাডজাস্টমেন্ট, মাল্টি-টাইমফ্রেম কনফার্মেশন, স্মার্ট মানি ম্যানেজমেন্ট এবং বাজার পরিবেশের সাথে অভিযোজন। এই অপ্টিমাইজেশনগুলি ট্রেডারদের নিজস্ব প্রয়োজন এবং বাজারের বৈশিষ্ট্য অনুসারে কৌশলটি সামঞ্জস্য করতে এবং সামগ্রিক ট্রেডিং ফলাফল উন্নত করতে সহায়তা করতে পারে।
উল্লেখযোগ্য যে, কোনো ট্রেডিং কৌশলই "জাদুর কাঠি" নয়। সফল ট্রেডিং কৌশলের পাশাপাশি ট্রেডারের ধৈর্য, শৃঙ্খলা এবং অবিরত শেখার প্রয়োজন হয়। এই কৌশলের জন্য, ট্রেডারদের প্রথমে সিমুলেটেড পরিবেশে যথেষ্ট পরীক্ষা করার, বিভিন্ন বাজার পরিস্থিতিতে এর পারফরম্যান্স বৈশিষ্ট্য সম্পর্কে জানার, এবং নির্দিষ্ট ট্রেডিং ইনস্ট্রুমেন্ট ও ব্যক্তিগত শৈলীর সাথে খাপ খাইয়ে নিতে ধীরে ধীরে প্যারামিটার সমন্বয় করার পরামর্শ দেওয়া হয়, যাতে শেষ পর্যন্ত একটি ব্যক্তিগতকৃত, টেকসই লাভজনক ট্রেডিং সিস্টেম তৈরি করা যায়।
অবিরত অনুশীলন, প্রতিক্রিয়া এবং অপ্টিমাইজেশনের মাধ্যমে, মাল্টি-ডাইমেনশনাল পিভট পয়েন্ট ট্রেডিং কৌশল এবং ডায়নামিক ফিবোনাচি ইন্ডিকেটর সিস্টেম ইন্ট্রাডে ট্রেডারদের টুলবক্সের একটি শক্তিশালী অস্ত্র হয়ে উঠতে পারে, যা দিনের মধ্যে বাজারের ওঠানামাকে কাজে লাগানোর জন্য একটি নির্ভরযোগ্য টেকনিক্যাল অ্যানালাইসিস ফ্রেমওয়ার্ক সরবরাহ করে।
- বাণিজ্য সংকেত তৈরি:
- যখন যোগ্য লাল মোমবাতি কোনো পিভট পয়েন্ট, সমর্থন স্তর, প্রতিরোধ স্তর বা VWAP/MVWAP স্পর্শ করে, তখন একটি ক্রয় সংকেত (CE) তৈরি হয়
- যখন যোগ্য সবুজ মোমবাতি কোনো পিভট পয়েন্ট, সমর্থন স্তর, প্রতিরোধ স্তর বা VWAP/MVWAP স্পর্শ করে, তখন একটি বিক্রয় সংকেত (PE) তৈরি হয়
কৌশলের মূল ধারণা হলো মূল সমর্থন ও প্রতিরোধ স্তরের কাছাকাছি সম্ভাব্য রিভার্সাল ধরা, যা নির্দিষ্ট মোমবাতির প্যাটার্ন এবং একাধিক টেকনিক্যাল ইন্ডিকেটরের মাধ্যমে ফিল্টার করে সংকেতের বৈধতা বাড়ানো। পিভট পয়েন্ট স্পর্শকারী মোমবাতিগুলো প্রায়ই এই মূল মূল্য স্তরে বাজারের দ্বিধা বা রিভার্সালের সম্ভাবনা বৃদ্ধির ইঙ্গিত দেয়।
কৌশলের সুবিধা
কৌশলের কোড গভীরভাবে বিশ্লেষণ করলে নিম্নলিখিত উল্লেখযোগ্য সুবিধাগুলো দেখা যায়:
-
বহুমাত্রিক যাচাইকরণ প্রক্রিয়া: বাণিজ্য সংকেত যাচাই করতে একাধিক টেকনিক্যাল ইন্ডিকেটর (পিভট পয়েন্ট, VWAP, মুভিং এভারেজ, RSI) একত্রিত করে, যা ভুল সংকেতের ঝুঁকি কমায়।
-
গতিশীল বাজার অভিযোজন: দৈনিক পিভট পয়েন্ট সিস্টেম প্রতিদিন আপডেট হয়, যা কৌশলটিকে বিভিন্ন বাজার পরিবেশ এবং অস্থিরতার সাথে খাপ খাইয়ে নিতে সাহায্য করে।
-
নির্ভুল মোমবাতি সনাক্তকরণ: কঠোর মোমবাতির প্যাটার্ন শর্ত এবং ফিবোনাচি স্তরের মাধ্যমে সম্ভাব্য বাণিজ্যের সুযোগ স্ক্রিন করে, সংকেতের গুণগত মান উন্নত করে।
-
নমনীয় প্রদর্শন সেটিংস: কৌশলটিতে ভিউ অ্যাডাপ্টেশন ফিচার রয়েছে, যা শুধুমাত্র উপযুক্ত টাইমফ্রেমে (১৫ মিনিটের নিচের ইন্ট্রাডে চার্ট) পিভট পয়েন্ট দেখায়, চার্টের জড়তা কমায়।
-
কন্ট্রারিয়ান চিন্তার সুবিধা: কৌশলটি লাল মোমবাতি মূল স্তর স্পর্শ করলে কেনার সুযোগ এবং সবুজ মোমবাতি মূল স্তর স্পর্শ করলে বিক্রয়ের সুযোগ খোঁজে, যা বাজারের স্বল্পমেয়াদী ওভারবট/ওভারসোল্ড অবস্থার সুযোগ নেয়।
-
সম্পূর্ণ মূল্য স্তর স্তরবিন্যাস: একাধিক সমর্থন ও প্রতিরোধ স্তর (S1-S4 এবং R1-R4) অন্তর্ভুক্ত, যা বিভিন্ন অস্থিরতা পরিসরের বাজার পরিবেশের জন্য সমৃদ্ধ রেফারেন্স মূল্য প্রদান করে।
-
ইন্টিগ্রেটেড সেন্ট্রাল পিভট রেঞ্জ (CPR): CPR দিনের জন্য সম্ভাব্য কনসলিডেশন এলাকা চিহ্নিত করতে সাহায্য করে, যা ইন্ট্রাডে ট্রেডিংয়ে গুরুত্বপূর্ণ রেফারেন্স মান রাখে।
-
ভিজ্যুয়াল সহায়তা: সমৃদ্ধ মার্কার এবং শেপের মাধ্যমে যোগ্য মোমবাতি এবং মূল স্তর স্পর্শের ঘটনা চার্টে স্বজ্ঞাতভাবে চিহ্নিত করা হয়, যা ট্রেডারদের দ্রুত সনাক্ত করতে সাহায্য করে।
-
ভলিউম নিশ্চিতকরণ: ভলিউম বিশ্লেষণ অন্তর্ভুক্ত করে, ভলিউম মুভিং এভারেজের মাধ্যমে বাজারের অংশগ্রহণ মূল্যায়ন করে, সংকেতের নির্ভরযোগ্যতা বাড়ায়।
-
ইন্ট্রাডে ট্রেডিংয়ের উপযোগী: কৌশলটি বিশেষভাবে স্বল্প টাইমফ্রেমের জন্য (বিশেষ করে ৩ মিনিটের চার্ট) ডিজাইন করা হয়েছে, যা ইন্ট্রাডে ট্রেডারদের জন্য উপযুক্ত যারা ঘন ঘন ট্রেডিংয়ের মাধ্যমে বাজারের ওঠানামার সুযোগ নিতে চান।
এই সুবিধাগুলো এই কৌশলটিকে একটি শক্তিশালী, অভিযোজনযোগ্য ইন্ট্রাডে ট্রেডিং সিস্টেমে পরিণত করে, বিশেষ করে যারা টেকনিক্যাল বিশ্লেষণ সম্পর্কে ভালো ধারণা রাখেন এবং প্রাইস অ্যাকশন ও মূল স্তরের ভিত্তিতে ট্রেড করতে চান তাদের জন্য উপযুক্ত।
কৌশলের ঝুঁকি
এর অনেক সুবিধা থাকা সত্ত্বেও, কৌশলটিতে কিছু সম্ভাব্য ঝুঁকি রয়েছে যা ট্রেডারদের যত্ন সহকারে বিবেচনা করা উচিত:
-
অতিরিক্ত সংকেতের ঝুঁকি: কৌশলটিতে একাধিক পিভট পয়েন্ট (PP, R1-R4, S1-S4) এবং অন্যান্য ইন্ডিকেটর জড়িত থাকায়, অস্থির বাজারে অনেক বেশি সংকেত তৈরি হতে পারে, যার ফলে ঘন ঘন ট্রেডিং এবং বর্ধিত ফি হতে পারে।
- সমাধান: অতিরিক্ত ফিল্টারিং শর্ত যোগ করার কথা বিবেচনা করুন, যেমন ট্রেডিং সেশন সীমাবদ্ধতা বা ট্রেন্ড নিশ্চিতকরণ শর্ত।
-
কন্ট্রারিয়ান ট্রেডিং ফাঁদ: কৌশলটি কন্ট্রারিয়ান লজিকের উপর ভিত্তি করে (লাল মোমবাতি মূল স্তর স্পর্শ করলে কিনুন, সবুজ মোমবাতি স্পর্শ করলে বিক্রি করুন), যা দৃঢ় ট্রেন্ডিং বাজারে ধারাবাহিক লোকসানের কারণ হতে পারে।
- সমাধান: কৌশল ব্যবহারের আগে সামগ্রিক বাজার ট্রেন্ড মূল্যায়ন করুন এবং শক্তিশালী ট্রেন্ডে কাউন্টার-ট্রেন্ড ট্রেডিং এড়াতে ট্রেন্ড ফিল্টার যুক্ত করুন।
৩. প্যারামিটার সংবেদনশীলতা: কৌশলের কার্যকারিতা মোমবাতি শনাক্তকরণ প্যারামিটার (যেমন, মোমবাতির উচ্চতা ১৭ পয়েন্টের বেশি হতে হবে) এবং চলমান গড় সময়সীমা সেটিংসের উপর অত্যন্ত নির্ভরশীল, যা বিভিন্ন বাজার পরিবেশে ভিন্ন প্যারামিটারের প্রয়োজন হতে পারে।
- সমাধান: প্যারামিটার সেটিংস অপ্টিমাইজ করার জন্য বিভিন্ন উপকরণ এবং বাজার পরিস্থিতির উপর ব্যাকটেস্ট করুন।
৪. স্টপ-লস মেকানিজমের অভাব: কোডে কোনো স্পষ্ট স্টপ-লস কৌশল নির্ধারণ করা হয়নি, যা একক ট্রেডে অতিরিক্ত ক্ষতির কারণ হতে পারে।
- সমাধান: স্পষ্ট স্টপ-লস কৌশল বাস্তবায়ন করুন, যেমন ATR-ভিত্তিক গতিশীল স্টপ-লস বা নির্দিষ্ট পয়েন্ট স্টপ-লস।
৫. ইন্ট্রাডে কৌশলের সীমাবদ্ধতা: ৩ মিনিটের চার্টে ফোকাস করা কৌশল হিসেবে, এটি মধ্যম থেকে দীর্ঘমেয়াদী ধারণের জন্য উপযুক্ত নয়, এবং দীর্ঘমেয়াদী ট্রেন্ডের সুযোগ হারাতে পারে।
- সমাধান: এই কৌশলটিকে একটি ট্রেডিং সিস্টেমের অংশ হিসেবে দেখুন, এবং মধ্যম ও দীর্ঘমেয়াদী কৌশলের সাথে একত্রে ব্যবহার করুন।
৬. পিভট পয়েন্টের সীমাবদ্ধতা: রেঞ্জ-বাউন্ড বাজারে, দাম ঘন ঘন একাধিক পিভট পয়েন্ট স্পর্শ করতে পারে, যা বিভ্রান্তিকর সংকেত তৈরি করে।
- সমাধান: কনসলিডেটিং বাজারে অস্থায়ীভাবে কৌশলটি নিষ্ক্রিয় করার বা সংকেত নিশ্চিতকরণ শর্ত যোগ করার বিবেচনা করুন।
৭. ভলিউম ওয়েট অ্যাডজাস্টমেন্টের অভাব: VWAP ব্যবহার করা হলেও, কৌশলটি ভলিউমের আকারের উপর ভিত্তি করে সংকেত ওয়েট গতিশীলভাবে সমন্বয় করে না।
- সমাধান: ভলিউম থ্রেশহোল্ড শর্ত যোগ করুন যাতে ট্রেড পর্যাপ্ত বাজার অংশগ্রহণের সাথে ঘটে।
৮. সময় নির্ভরতা: দৈনিক পিভট পয়েন্ট পূর্ববর্তী দিনের তথ্যের উপর ভিত্তি করে তৈরি, এবং নতুন ট্রেডিং দিনের শুরুতে বর্তমান দিনের তথ্য অপর্যাপ্ত হওয়ায় অস্থিরভাবে কাজ করতে পারে।
- সমাধান: ট্রেডিং দিন শুরু হওয়ার ৩০-৬০ মিনিট পরে কৌশলটি সক্রিয় করার বিবেচনা করুন, যাতে পর্যাপ্ত বাজার তথ্য সংগ্রহ করা যায়।
৯. অটোমেশন বাস্তবায়নের চ্যালেঞ্জ: কৌশলটিতে একাধিক শর্ত বিচার জড়িত, এবং প্রকৃত স্বয়ংক্রিয় সম্পাদনে বিলম্ব বা সময়মতো সম্পাদন না হওয়ার সম্মুখীন হতে পারে।
- সমাধান: কম লেটেন্সি নিশ্চিত করতে নির্বাহ সিস্টেম অপ্টিমাইজ করুন, বা ম্যানুয়াল নিশ্চিতকরণের সাথে মিলিত আধা-স্বয়ংক্রিয় পদ্ধতি বিবেচনা করুন।
১০. ব্যাকটেস্ট বায়াস ঝুঁকি: কোডে সবুজ/লাল মোমবাতি শনাক্তকরণ যুক্তি ব্যাকটেস্ট এবং লাইভ ট্রেডিং পরিবেশের মধ্যে অসমভাবে কাজ করতে পারে।
- সমাধান: কঠোর লাইভ সিমুলেশন পরীক্ষা পরিচালনা করুন যাতে কৌশলটি প্রকৃত ট্রেডিং পরিবেশে কার্যকর থাকে।
এই ঝুঁকিগুলি চিহ্নিত করা এবং পরিচালনা করা এই কৌশল সফলভাবে প্রয়োগ করার জন্য অত্যন্ত গুরুত্বপূর্ণ। ট্রেডারদের নিজস্ব ঝুঁকি সহনশীলতা এবং ট্রেডিং অভ্যাস অনুযায়ী উপযুক্ত সমন্বয় করা উচিত।
কৌশল অপ্টিমাইজেশনের দিকনির্দেশনা
কোডের গভীর বিশ্লেষণের ভিত্তিতে, এই কৌশলটি অপ্টিমাইজ করার জন্য নিম্নলিখিত মূল দিকনির্দেশনা রয়েছে:
১. গতিশীল মোমবাতি শনাক্তকরণ প্যারামিটার:
- বর্তমান কৌশলে কার্যকর মোমবাতি শনাক্ত করতে স্থির মান ব্যবহার করা হয় (যেমন মোমবাতির উচ্চতা কমপক্ষে ১৭ পয়েন্ট)। এটি ATR (গড় সত্যিকারের পরিসর) ভিত্তিক গতিশীল প্যারামিটারে পরিবর্তন করা যেতে পারে যাতে বিভিন্ন অস্থিরতা পরিবেশের সাথে আরও ভালভাবে খাপ খাইয়ে নেওয়া যায়।
- অপ্টিমাইজেশনের যুক্তি: স্থির প্যারামিটার বিভিন্ন অস্থিরতা পরিবেশে ভিন্নভাবে কাজ করে; গতিশীল প্যারামিটার কৌশলের অভিযোজন ক্ষমতা উন্নত করতে পারে।
২. ট্রেন্ড ফিল্টারিং সিস্টেম:
- উচ্চ টাইমফ্রেম (যেমন ১৫ মিনিট বা ৩০ মিনিট) থেকে ট্রেন্ড নির্ধারণ যোগ করুন যাতে শুধুমাত্র মূল ট্রেন্ডের দিকে ট্রেড করা যায় বা সংকেত ওয়েট সমন্বয় করা যায়।
- অপ্টিমাইজেশনের যুক্তি: শক্তিশালী ট্রেন্ডে ঘন ঘন কাউন্টার-ট্রেন্ড ট্রেডিং এড়ানো, জয় রেট এবং ঝুঁকি-পুরস্কার অনুপাত উন্নত করা।
৩. সংকেত মান স্কোরিং মেকানিজম:
- প্রতিটি ট্রেডিং সংকেতের জন্য একটি সমন্বিত স্কোরিং সিস্টেম স্থাপন করুন, যা মোমবাতির শক্তি, স্পর্শ করা পিভট পয়েন্টের গুরুত্ব, RSI মান, ভলিউম অস্বাভাবিকতা ইত্যাদি একাধিক উপাদান বিবেচনা করে।
- অপ্টিমাইজেশনের যুক্তি: সব সংকেতের গুণমান সমান নয়; একটি স্কোরিং সিস্টেম নিম্নমানের সংকেত ফিল্টার করতে এবং ট্রেডিং দক্ষতা উন্নত করতে পারে।
-
মূলধন ব্যবস্থাপনা সংযোজন:
- সংকেত শক্তি এবং বাজার পরিস্থিতির ভিত্তিতে অবস্থানের আকার গতিশীলভাবে সামঞ্জস্য করুন, উচ্চ-সম্ভাবনার সুযোগে অবস্থান বাড়ান এবং নিম্ন-সম্ভাবনার পরিস্থিতিতে ঝুঁকি এক্সপোজার কমান।
- অনুকূলনের যুক্তি: কার্যকরী মূলধন ব্যবস্থাপনা দীর্ঘমেয়াদী লাভজনকতার জন্য গুরুত্বপূর্ণ এবং কৌশলের কর্মক্ষমতা উল্লেখযোগ্যভাবে উন্নত করতে পারে।
-
একাধিক টাইমফ্রেম নিশ্চিতকরণ:
- সংকেত তৈরি করার আগে একাধিক টাইমফ্রেমে শর্তের ধারাবাহিকতা পরীক্ষা করুন, উদাহরণস্বরূপ, শুধুমাত্র তখনই ট্রেড করুন যখন ৩-মিনিট এবং ১৫-মিনিটের চার্টের সংকেত মিলে যায়।
- অনুকূলনের যুক্তি: একাধিক টাইমফ্রেম নিশ্চিতকরণ ভুয়া সংকেতের সম্ভাবনা হ্রাস করতে পারে এবং ট্রেডিং নির্ভুলতা উন্নত করতে পারে।
-
স্টপ-লস এবং টেক-প্রফিট প্রক্রিয়া:
- স্মার্ট স্টপ-লস সিস্টেম প্রয়োগ করুন, যেমন অস্থিরতা-ভিত্তিক গতিশীল স্টপ-লস বা মূল কাঠামোগত অবস্থানের স্টপ-লস, পাশাপাশি স্বয়ংক্রিয় টেক-প্রফিট লক্ষ্য নির্ধারণ করুন।
- অনুকূলনের যুক্তি: সঠিক ঝুঁকি ব্যবস্থাপনা বড় ড্রডাউন এড়ানো এবং মুনাফা সুরক্ষিত করার জন্য গুরুত্বপূর্ণ।
-
ট্রেডিং সময় ফিল্টার:
- দক্ষ এবং অদক্ষ ট্রেডিং সেশন চিহ্নিত করুন, কম অস্থিরতার সময় বা বিশৃঙ্খল সময়গুলি (যেমন লাঞ্চের সময় বা বাজার খোলার এবং বন্ধের আগে ও পরে) এড়িয়ে চলুন।
- অনুকূলনের যুক্তি: বিভিন্ন সেশনে বাজারের আচরণের বৈশিষ্ট্য ভিন্ন; নির্বাচনী ট্রেডিং সামগ্রিক দক্ষতা উন্নত করতে পারে।
-
অভিযোজিত নির্দেশক প্যারামিটার:
- স্থির প্রযুক্তিগত নির্দেশক প্যারামিটার (যেমন ১৪-পিরিয়ড RSI, ২০-পিরিয়ড EMA) পরিবর্তন করে বাজারের অবস্থার ভিত্তিতে স্বয়ংক্রিয়ভাবে সামঞ্জস্যযোগ্য প্যারামিটার ব্যবহার করুন।
- অনুকূলনের যুক্তি: যখন বাজারের অবস্থা পরিবর্তিত হয়, সর্বোত্তম নির্দেশক প্যারামিটারগুলিও তদনুযায়ী পরিবর্তিত হওয়া উচিত, যা নির্দেশকের সংবেদনশীলতা উন্নত করে।
-
বাজার পরিবেশ শ্রেণীবিভাগ:
- বর্তমান বাজার পরিবেশ (ট্রেন্ডিং, কনসলিডেটিং, উচ্চ অস্থিরতা ইত্যাদি) স্বয়ংক্রিয়ভাবে চিহ্নিত করার জন্য অ্যালগরিদম যুক্ত করুন এবং বিভিন্ন পরিবেশের জন্য ভিন্ন প্যারামিটার সেটিংস প্রয়োগ করুন।
- অনুকূলনের যুক্তি: একক প্যারামিটার সেটিংস সকল বাজার পরিবেশে সর্বোত্তমভাবে কাজ করা কঠিন; পরিবেশ-অভিযোজিত সামঞ্জস্য কৌশলের স্থিতিশীলতা উল্লেখযোগ্যভাবে বাড়াতে পারে।
-
মেশিন লার্নিং উন্নতি:
- সংকেত সাফল্যের সম্ভাবনা পূর্বাভাস দেওয়ার জন্য মেশিন লার্নিং মডেল সংযোজন বিবেচনা করুন, ঐতিহাসিক প্যাটার্ন শনাক্তকরণের ভিত্তিতে ট্রেডিং সংকেত ফিল্টার এবং অগ্রাধিকার দিন।
- অনুকূলনের যুক্তি: মেশিন লার্নিং মানুষের পক্ষে শনাক্ত করা কঠিন জটিল প্যাটার্ন আবিষ্কার করতে পারে, কৌশলের বুদ্ধিমত্তার স্তর বৃদ্ধি করে।
এই অনুকূলন দিকগুলি বাস্তবায়নের মাধ্যমে, কৌশলটি তার মূল সুবিধাগুলি বজায় রেখে অভিযোজনযোগ্যতা, নির্ভুলতা এবং দীর্ঘমেয়াদী লাভজনকতা উল্লেখযোগ্যভাবে উন্নত করতে পারে, বিভিন্ন বাজার পরিস্থিতির চ্যালেঞ্জগুলি আরও ভালভাবে মোকাবেলা করতে সক্ষম হবে।
সারসংক্ষেপ
মাল্টি-ডাইমেনশনাল পিভট পয়েন্ট ট্রেডিং সিস্টেম উইথ ডায়নামিক ফিবোনাচি ইন্ডিকেটরস একটি বিস্তৃত, সুসংগঠিত ইন্ট্রাডে ট্রেডিং কৌশল সিস্টেম। এটি দক্ষতার সাথে ঐতিহ্যবাহী প্রযুক্তিগত বিশ্লেষণ সরঞ্জামগুলি (পিভট পয়েন্ট, ফিবোনাচি রিট্রেসমেন্ট, মুভিং এভারেজ) আধুনিক গতিশীল নির্দেশকগুলির (VWAP, CPR) সাথে একত্রিত করে। কঠোর ক্যান্ডেল শর্ত স্ক্রীনিং এবং একাধিক নির্দেশক নিশ্চিতকরণের মাধ্যমে, এটি ট্রেডারদের জন্য একটি সম্ভাবনাময় ইন্ট্রাডে ট্রেডিং ফ্রেমওয়ার্ক সরবরাহ করে।
এই কৌশলের মূল সুবিধা হল মূল মূল্য স্তরের ব্যাপক কভারেজ এবং সম্ভাব্য রিভার্সাল পয়েন্টগুলির সংবেদনশীল ক্যাপচার। কঠোর ক্যান্ডেল শনাক্তকরণ শর্ত নির্ধারণ করে, কৌশলটি বিপুল পরিমাণ অর্থহীন বাজার শব্দ ফিল্টার করে উচ্চ-সম্ভাবনার ট্রেডিং সুযোগগুলিতে ফোকাস করতে পারে। একই সময়ে, ভলিউম এবং মোমেন্টাম নির্দেশকের ব্যবহার সংকেত নির্ভরযোগ্যতা আরও বাড়িয়ে তোলে।
তবে, কৌশলটির কিছু সীমাবদ্ধতাও রয়েছে, যেমন অতিরিক্ত সংকেত, বিপরীতমুখী ট্রেডিং ঝুঁকি এবং প্যারামিটার অপ্টিমাইজেশনের চ্যালেঞ্জ। এই সমস্যাগুলি সমাধানের জন্য, আমরা বেশ কয়েকটি অপ্টিমাইজেশন দিক প্রস্তাব করেছি, যার মধ্যে রয়েছে গতিশীল প্যারামিটার সমন্বয়, একাধিক টাইমফ্রেম নিশ্চিতকরণ, বুদ্ধিমান মূলধন ব্যবস্থাপনা এবং বাজার পরিবেশ অভিযোজন। এই অপ্টিমাইজেশনগুলি ট্রেডারদের তাদের নিজস্ব প্রয়োজন এবং বাজারের বৈশিষ্ট্য অনুযায়ী কৌশলটি সামঞ্জস্য করতে সাহায্য করতে পারে, সামগ্রিক ট্রেডিং কার্যকারিতা উন্নত করে।
এটি লক্ষণীয় যে, কোনো ট্রেডিং কৌশলই "ম্যাজিক বুলেট" নয়। সফল ট্রেডিং শুধুমাত্র কৌশলের উপরই নির্ভর করে না, বরং ট্রেডারের ধৈর্য, শৃঙ্খলা এবং ক্রমাগত শেখার উপরও নির্ভর করে। এই কৌশলের জন্য, ট্রেডারদের প্রথমে একটি সিমুলেটেড পরিবেশে এটি সম্পূর্ণরূপে পরীক্ষা করার, বিভিন্ন বাজার অবস্থার অধীনে এর কর্মক্ষমতা বৈশিষ্ট্যগুলির সাথে পরিচিত হওয়ার, নির্দিষ্ট ট্রেডিং যন্ত্র এবং ব্যক্তিগত শৈলীর সাথে খাপ খাইয়ে নিতে ধীরে ধীরে প্যারামিটারগুলি সামঞ্জস্য করার এবং শেষ পর্যন্ত একটি ব্যক্তিগতকৃত, টেকসই লাভজনক ট্রেডিং সিস্টেম গঠনের সুপারিশ করা হচ্ছে।
অবিরাম অনুশীলন, প্রতিক্রিয়া এবং অপ্টিমাইজেশনের মাধ্যমে, ডাইনামিক ফিবোনাচি সূচক সহ মাল্টি-ডাইমেনশনাল পিভট পয়েন্ট ট্রেডিং সিস্টেম একজন ইন্ট্রাডে ট্রেডারের টুলবক্সে একটি শক্তিশালী অস্ত্র হয়ে উঠতে পারে, যা স্বল্পমেয়াদী বাজারের সুযোগগুলি ক্যাপচার করার জন্য একটি নির্ভরযোগ্য প্রযুক্তিগত বিশ্লেষণ কাঠামো প্রদান করে।
কৌশলটির প্রচলিত পিভট পয়েন্টের সাথে আধুনিক প্রযুক্তিগত সরঞ্জামের একীকরণ একটি সুষম পদ্ধতি তৈরি করে যা বাজারের কাঠামোকে সম্মান করে এবং একই সাথে ইন্ট্রাডে মূল্য আন্দোলনের প্রতি প্রতিক্রিয়াশীল থাকে। সমালোচনামূলক স্তরে মূল মূল্য মিথস্ক্রিয়ায় মনোনিবেশ করে, ট্রেডাররা বাজারের মনোবিজ্ঞানের গভীর উপলব্ধি বিকাশ করতে পারে এবং সম্ভাব্যভাবে তাদের ট্রেডিং কর্মক্ষমতা উন্নত করতে পারে।
শেষ পর্যন্ত, সফল বাস্তবায়নের জন্য চিন্তাশীল কাস্টমাইজেশন, কঠোর পরীক্ষা এবং শৃঙ্খলাবদ্ধ সম্পাদনের প্রয়োজন হবে। যখন একটি বিস্তৃত ট্রেডিং পরিকল্পনার অংশ হিসাবে যথাযথভাবে প্রয়োগ করা হয় যার মধ্যে সঠিক ঝুঁকি ব্যবস্থাপনা নীতিমালা অন্তর্ভুক্ত থাকে, তখন এই কৌশলটি আরও আত্মবিশ্বাস এবং নির্ভুলতার সাথে ইন্ট্রাডে বাজারের জটিলতাগুলি নেভিগেট করার জন্য একটি পদ্ধতিগত পদ্ধতি প্রদান করে।
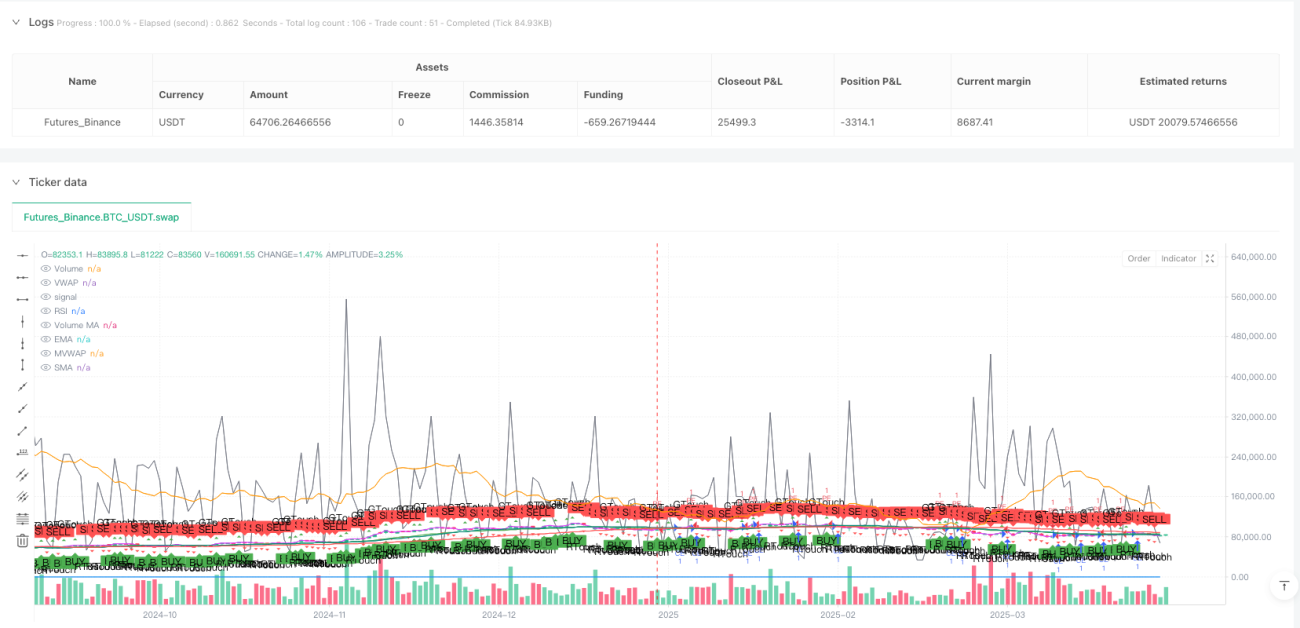
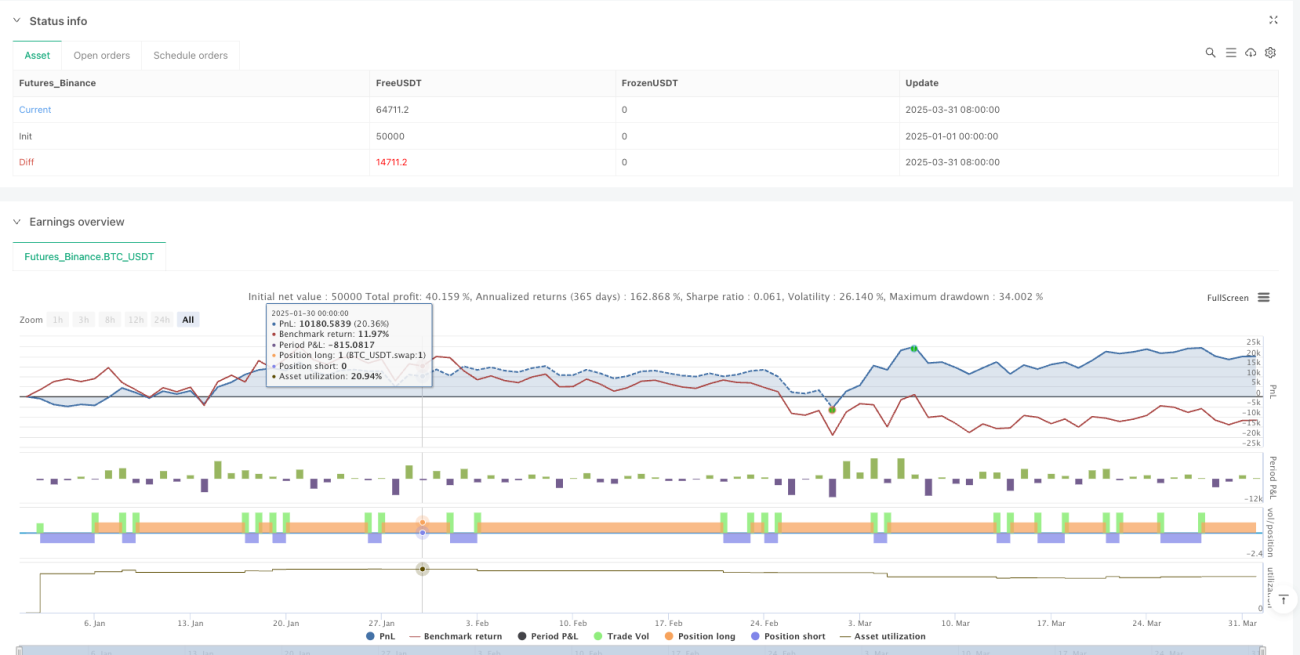
/*backtest
start: 2025-01-01 00:00:00
end: 2025-04-01 00:00:00
period: 1d
basePeriod: 1d
exchanges: [{"eid":"Futures_Binance","currency":"BTC_USDT"}]
*/

//@version=5
strategy("Pivot Point CE/PE Strategy", overlay=true)

// Identify 3-minute candles (Assuming the script is applied to a 3-minute chart)- 1