
[trans]
概述
多维枢轴点交易策略与动态斐波那契指标系统是一个基于技术分析的交易策略,主要利用日内枢轴点、中枢区间(CPR)、斐波那契回撤水平、成交量加权平均价(VWAP)和移动平均线等多重指标来识别潜在的买入和卖出机会。该策略适用于日内交易者,特别是针对3分钟K线图的短线交易。策略核心在于判断特定条件的K线是否接触到关键支撑与阻力位,从而触发交易信号。
该策略利用每日高点、低点和收盘价计算的枢轴点系统,结合成交量加权平均价(VWAP)和移动VWAP(MVWAP)作为动态支撑阻力参考。同时,通过相对强弱指数(RSI)、简单移动平均线(SMA)和指数移动平均线(EMA)等技术指标,构建了一个全面的交易决策系统。
策略首先识别符合条件的绿色(上涨)和红色(下跌)K线,然后判断这些K线是否触及到关键价格水平,如枢轴点、支撑位、阻力位或VWAP等。当红色K线触及关键价格水平时,触发买入信号(CE);当绿色K线触及关键价格水平时,触发卖出信号(PE)。这种反转思路体现了在关键价格水平寻找潜在反转点的核心理念。
策略原理
该策略的原理建立在价格围绕关键支撑与阻力位波动的市场行为基础上,结合K线形态、成交量和动量指标进行交易决策。具体原理解析如下:
-
K线识别机制:
- 绿色K线(上涨):收盘价高于开盘价,K线实体高度至少17个点,开盘价低于低点加上0.382倍K线范围,收盘价高于低点加上0.682倍K线范围。
- 红色K线(下跌):收盘价低于开盘价,K线实体高度至少17个点。
-
枢轴点计算体系:
- 日枢轴点(PP):(日高点 + 日低点 + 日收盘价) / 3
- 阻力位:R1、R2、R3、R4
- 支撑位:S1、S2、S3、S4
- 中枢区间(CPR):由底部CPR和顶部CPR组成,提供了市场可能盘整的价格区域
-
价格动态参考:
- VWAP(成交量加权平均价):反映了考虑成交量因素后的平均价格水平
- MVWAP(移动成交量加权平均价):VWAP的移动平均,提供更平滑的价格参考
-
辅助指标系统:
- RSI:用于衡量市场超买超卖情况
- SMA(50周期)和EMA(20周期):提供价格趋势方向参考
- 成交量分析:通过20周期成交量均线评估成交量趋势
-
交易信号生成:
- 当符合条件的红色K线触及任何枢轴点、支撑位、阻力位或VWAP/MVWAP时,生成买入信号(CE)
- 当符合条件的绿色K线触及任何枢轴点、支撑位、阻力位或VWAP/MVWAP时,生成卖出信号(PE)
策略核心思想是捕捉价格在关键支撑阻力位附近的潜在反转,通过特定K线形态和多重技术指标过滤,提高信号有效性。触及枢轴点的K线往往代表市场在这些关键价格水平处出现犹豫或反转的可能性增加。
策略优势
深入分析该策略代码,我们可以总结出以下显著优势:
-
多维度验证机制:结合多种技术指标(枢轴点、VWAP、移动平均线、RSI)验证交易信号,降低假信号风险。
-
动态适应市场:日内枢轴点系统每天更新,使策略能够适应不同市场环境和波动率。
-
精确的K线识别:通过严格的K线形态条件和斐波那契水平来筛选有潜力的交易机会,提高信号质量。
-
灵活的显示设置:策略具有视图自适应功能,只在合适的时间框架(15分钟以下的日内图表)显示枢轴点,减少图表杂乱。
-
反向思维优势:策略在红色K线触及关键位置时寻找买入机会,在绿色K线触及关键位置时寻找卖出机会,利用市场可能的短期超买超卖状态。
-
完整的价格层次体系:包含多层支撑阻力(S1-S4和R1-R4),提供丰富的参考价格,适合不同波动幅度的市场环境。
-
整合中枢区间(CPR):CPR提供了当日潜在的盘整区域识别,这在日内交易中具有重要参考价值。
-
视觉化辅助:通过丰富的标记和形状显示,直观地在图表上标识出符合条件的K线和触及关键价格的情况,便于交易者快速识别。
-
成交量确认:结合成交量分析,通过成交量均线评估市场参与度,增强信号可靠性。
-
适合日内交易:策略专为短时间框架(尤其是3分钟图表)设计,适合日内交易者利用市场波动进行频繁交易。
以上优势使该策略成为一个综合性强、适应性好的日内交易系统,特别适合对技术分析有一定了解并希望基于价格行为和关键价格水平进行交易的投资者。
策略风险
尽管该策略具有多项优势,但同时也存在一些潜在风险,需要交易者谨慎应对:
-
信号过多风险:由于策略涉及多个枢轴点(PP、R1-R4、S1-S4)以及其他指标,可能在波动剧烈的市场中产生过多信号,导致交易频繁和手续费增加。
- 解决方法:可考虑添加额外过滤条件,如交易时段限制或趋势确认条件。
-
反向交易陷阱:策略基于反向逻辑(红色K线触及关键位置买入,绿色K线触及关键位置卖出),在强趋势市场中可能导致连续亏损。
- 解决方法:在使用策略前评估整体市场趋势,可增加趋势过滤器避免在强趋势中逆势交易。
-
参数敏感性:策略效果高度依赖于K线识别参数(如K线高度需大于17点)和移动平均线周期设置,不同市场环境可能需要不同参数。
- 解决方法:对不同品种和市场条件进行回测,优化参数设置。
-
缺乏止损机制:代码中未明确设置止损策略,可能导致单笔亏损过大。
- 解决方法:实施明确的止损策略,如基于ATR的动态止损或固定点数止损。
-
日内策略局限性:作为专注于3分钟图表的日内策略,不适合中长期持有,错过可能的长期趋势机会。
- 解决方法:将该策略视为交易体系的一部分,配合中长期策略使用。
-
枢轴点局限性:在横盘市场中,价格可能频繁触及多个枢轴点,产生混乱信号。
- 解决方法:在盘整市场中可考虑暂时关闭策略或增加信号确认条件。
-
缺乏成交量权重调整:虽然使用了VWAP,但策略并未根据成交量大小动态调整信号权重。
- 解决方法:可增加成交量阈值条件,确保在足够市场参与度的情况下交易。
-
时间依赖性:日枢轴点基于前一日数据,在新交易日开始时可能因缺乏当日足够数据而表现不稳定。
- 解决方法:考虑在交易日前30-60分钟后再启用策略,以获取足够市场信息。
-
自动化实施挑战:策略涉及多重条件判断,实际自动化执行时可能面临延迟或执行不及时问题。
- 解决方法:优化执行系统,确保低延迟,或考虑半自动化方式结合人工确认。
-
回测偏差风险:代码中绿色/红色K线识别逻辑可能在回测与实盘环境中表现不一致。
- 解决方法:进行严格的实盘模拟测试,确保策略在实际交易环境中仍然有效。
认识并管理这些风险对于成功应用该策略至关重要,交易者应根据自身风险承受能力和交易习惯进行适当调整。
策略优化方向
基于对代码的深入分析,以下是该策略可以优化的关键方向:
-
动态K线识别参数:
- 当前策略使用固定值(如K线高度至少17点)来识别有效K线,可改为基于ATR(平均真实波动范围)的动态参数,使策略更好地适应不同波动率环境。
- 优化理由:固定参数在不同波动率环境下效果差异大,动态参数可提高策略适应性。
-
趋势过滤系统:
- 添加更高时间框架(如15分钟或30分钟)的趋势判断,只在主趋势方向执行交易或调整信号权重。
- 优化理由:避免在强趋势中频繁逆势交易,提高胜率和盈亏比。
-
信号质量评分机制:
- 为每个交易信号建立综合评分系统,考虑多项因素如:K线强度、触及的枢轴点重要性、RSI值、成交量异常等。
- 优化理由:不是所有信号质量相等,评分系统可过滤低质量信号,提高交易效率。
-
资金管理集成:
- 根据信号强度和市场条件动态调整仓位大小,在高概率机会增加仓位,低概率情况减少风险敞口。
- 优化理由:有效的资金管理对长期盈利至关重要,可显著改善策略绩效。
-
多时间框架确认:
- 在生成信号前检查多个时间框架的条件一致性,比如3分钟和15分钟图表的信号一致时交易。
- 优化理由:多时间框架确认可降低错误信号概率,提高交易精确度。
-
止损和止盈机制:
- 实施智能止损系统,如基于波动率的动态止损或关键结构位置止损,同时设置自动止盈目标。
- 优化理由:完善的风险管理对避免大幅回撤和保护利润至关重要。
-
交易时间过滤:
- 识别高效和低效交易时段,避开市场波动性较低或混乱的时段(如午餐时间或市场开盘和收盘前后)。
- 优化理由:不同时段市场行为特征不同,选择性交易可提高整体效率。
-
自适应指标参数:
- 将固定的技术指标参数(如RSI的14周期,EMA的20周期)改为基于市场状态自动调整的参数。
- 优化理由:市场条件变化时,最优指标参数也应相应调整,提高指标敏感性。
-
市场环境分类:
- 添加算法自动识别当前市场环境(趋势、盘整、高波动等),并针对不同环境应用不同的参数设置。
- 优化理由:单一参数设置难以在所有市场环境中表现最佳,环境适应性调整可显著提升策略稳定性。
-
机器学习增强:
- 考虑整合机器学习模型预测信号成功概率,基于历史模式识别对交易信号进行筛选和优先级排序。
- 优化理由:机器学习可发现人工难以识别的复杂模式,提高策略智能化水平。
通过实施以上优化方向,该策略可以在保持原有优势的基础上,显著提高适应性、准确性和长期盈利能力,更好地应对各种市场条件挑战。
总结
多维枢轴点交易策略与动态斐波那契指标系统是一个综合性强、结构完善的日内交易策略系统。它巧妙地结合了传统技术分析工具(枢轴点、斐波那契回撤、移动平均线)与现代动态指标(VWAP、CPR),通过严格的K线条件筛选和多重指标确认,为交易者提供了一个有潜力的日内交易框架。
该策略的核心优势在于其对关键价格水平的全面覆盖和对潜在反转点的敏感捕捉。通过设置严格的K线识别条件,策略能够过滤掉大量无意义的市场噪音,专注于高概率的交易机会。同时,结合成交量和动量指标的使用,进一步增强了信号的可靠性。
然而,策略也存在一些局限性,如信号可能过多、反向交易风险以及参数优化挑战等。针对这些问题,我们提出了多个优化方向,包括动态参数调整、多时间框架确认、智能资金管理以及市场环境适应等,这些优化可以帮助交易者根据自身需求和市场特点调整策略,提高整体交易效果。
值得注意的是,任何交易策略都不是"点石成金"的工具,成功的交易除了依赖策略本身,还需要交易者的耐心、纪律和持续学习。对于该策略,建议交易者首先在模拟环境中充分测试,熟悉其在不同市场条件下的表现特点,逐步调整参数以适应特定交易品种和个人风格,最终形成一个个性化的、可持续盈利的交易系统。
通过不断的实践、反馈和优化,多维枢轴点交易策略与动态斐波那契指标系统可以成为日内交易者工具箱中的有力武器,为把握日内市场波动提供可靠的技术分析框架。 ||
Overview
The Multi-Dimensional Pivot Point Trading System with Dynamic Fibonacci Indicators is a technical analysis-based trading strategy that utilizes daily pivot points, Central Pivot Range (CPR), Fibonacci retracement levels, Volume Weighted Average Price (VWAP), and moving averages to identify potential buying and selling opportunities. This strategy is particularly suitable for intraday traders, especially those focusing on 3-minute chart timeframes. The core of the strategy is determining whether candles meeting specific conditions touch key support and resistance levels, thereby triggering trading signals.
The strategy employs a pivot point system calculated from daily high, low, and close prices, combined with Volume Weighted Average Price (VWAP) and Moving VWAP (MVWAP) as dynamic support and resistance references. It also incorporates technical indicators such as the Relative Strength Index (RSI), Simple Moving Average (SMA), and Exponential Moving Average (EMA) to create a comprehensive trading decision system.
The strategy first identifies qualifying green (bullish) and red (bearish) candles, then determines if these candles touch key price levels such as pivot points, support levels, resistance levels, or VWAP. When a red candle touches a key price level, it triggers a buy signal (CE); when a green candle touches a key price level, it triggers a sell signal (PE). This contrarian approach reflects the core concept of seeking potential reversal points at key price levels.
Strategy Principles
The principles of this strategy are built on market behavior where prices fluctuate around key support and resistance levels, combined with candle patterns, volume, and momentum indicators for trading decisions. The specific principles are analyzed as follows:
-
Candle Identification Mechanism:
- Green Candle (Bullish): Close higher than open, candle body height at least 17 points, open lower than low plus 0.382 times candle range, close higher than low plus 0.682 times candle range.
- Red Candle (Bearish): Close lower than open, candle body height at least 17 points.
-
Pivot Point Calculation System:
- Daily Pivot Point (PP): (Daily High + Daily Low + Daily Close) / 3
- Resistance Levels: R1, R2, R3, R4
- Support Levels: S1, S2, S3, S4
- Central Pivot Range (CPR): Comprised of bottom CPR and top CPR, providing a price region where the market may consolidate
-
Dynamic Price References:
- VWAP (Volume Weighted Average Price): Reflects the average price level considering volume factors
- MVWAP (Moving Volume Weighted Average Price): Moving average of VWAP, providing a smoother price reference
-
Auxiliary Indicator System:
- RSI: Used to measure market overbought/oversold conditions
- SMA (50-period) and EMA (20-period): Provide price trend direction references
- Volume Analysis: Assesses volume trends through 20-period volume moving average
-
Trade Signal Generation:
- When qualifying red candles touch any pivot point, support level, resistance level, or VWAP/MVWAP, a buy signal (CE) is generated
- When qualifying green candles touch any pivot point, support level, resistance level, or VWAP/MVWAP, a sell signal (PE) is generated
The core idea of the strategy is to capture potential reversals near key support and resistance levels, filtered through specific candle patterns and multiple technical indicators to enhance signal validity. Candles touching pivot points often represent increased possibility of market hesitation or reversal at these key price levels.
Strategy Advantages
Deep analysis of the strategy code reveals the following significant advantages:
-
Multi-dimensional Verification Mechanism: Combines multiple technical indicators (pivot points, VWAP, moving averages, RSI) to validate trading signals, reducing false signal risk.
-
Dynamic Market Adaptation: Daily pivot point system updates daily, allowing the strategy to adapt to different market environments and volatilities.
-
Precise Candle Identification: Screens potential trading opportunities through strict candle pattern conditions and Fibonacci levels, improving signal quality.
-
Flexible Display Settings: The strategy features view adaptation functionality, only displaying pivot points in appropriate timeframes (intraday charts below 15 minutes), reducing chart clutter.
-
Contrarian Thinking Advantage: The strategy looks for buying opportunities when red candles touch key levels and selling opportunities when green candles touch key levels, leveraging potential short-term overbought/oversold market conditions.
-
Complete Price Level Hierarchy: Includes multiple layers of support and resistance (S1-S4 and R1-R4), providing rich reference prices suitable for market environments with different volatility ranges.
-
Integrated Central Pivot Range (CPR): CPR provides identification of potential consolidation areas for the day, which has important reference value in intraday trading.
-
Visual Assistance: Through rich markers and shapes, qualifying candles and instances of touching key price levels are intuitively marked on the chart, enabling traders to quickly identify them.
-
Volume Confirmation: Incorporates volume analysis, assessing market participation through volume moving averages, enhancing signal reliability.
-
Suitable for Intraday Trading: The strategy is specially designed for short timeframes (particularly 3-minute charts), suitable for intraday traders looking to capitalize on market fluctuations through frequent trading.
These advantages make this strategy a strong, adaptive intraday trading system, particularly suitable for investors with a good understanding of technical analysis who wish to trade based on price action and key price levels.
Strategy Risks
Despite its many advantages, the strategy also presents several potential risks that traders should carefully address:
-
Excessive Signal Risk: Due to the strategy involving multiple pivot points (PP, R1-R4, S1-S4) and other indicators, it may generate too many signals in volatile markets, leading to frequent trading and increased fees.
- Solution: Consider adding additional filtering conditions, such as trading session limitations or trend confirmation conditions.
-
Contrarian Trading Trap: The strategy is based on contrarian logic (buy when red candles touch key levels, sell when green candles touch key levels), which may lead to consecutive losses in strong trending markets.
- Solution: Assess the overall market trend before using the strategy, and add trend filters to avoid counter-trend trading in strong trends.
-
Parameter Sensitivity: Strategy effectiveness is highly dependent on candle identification parameters (e.g., candle height must exceed 17 points) and moving average period settings, which may require different parameters in different market environments.
- Solution: Backtest different instruments and market conditions to optimize parameter settings.
-
Lack of Stop-Loss Mechanism: No explicit stop-loss strategy is set in the code, which may lead to excessive single-trade losses.
- Solution: Implement clear stop-loss strategies, such as ATR-based dynamic stop-losses or fixed-point stop-losses.
-
Intraday Strategy Limitations: As a strategy focusing on 3-minute charts, it is not suitable for medium to long-term holdings, potentially missing opportunities in longer-term trends.
- Solution: View this strategy as part of a trading system, used in conjunction with medium and long-term strategies.
-
Pivot Point Limitations: In range-bound markets, prices may frequently touch multiple pivot points, generating confusing signals.
- Solution: Consider temporarily disabling the strategy or adding signal confirmation conditions in consolidating markets.
-
Lack of Volume Weight Adjustment: Although VWAP is used, the strategy does not dynamically adjust signal weights based on volume size.
- Solution: Add volume threshold conditions to ensure trading occurs with sufficient market participation.
-
Time Dependency: Daily pivot points are based on previous day's data, and may perform unstably at the beginning of a new trading day due to insufficient current day data.
- Solution: Consider enabling the strategy 30-60 minutes after the trading day begins to gather sufficient market information.
-
Automation Implementation Challenges: The strategy involves multiple condition judgments, and may face delays or untimely execution during actual automated execution.
- Solution: Optimize execution systems to ensure low latency, or consider semi-automated methods combined with manual confirmation.
-
Backtest Bias Risk: The green/red candle identification logic in the code may perform inconsistently between backtesting and live trading environments.
- Solution: Conduct rigorous live simulation testing to ensure the strategy remains effective in actual trading environments.
Recognizing and managing these risks is crucial for successfully applying this strategy. Traders should make appropriate adjustments based on their risk tolerance and trading habits.
Strategy Optimization Directions
Based on deep analysis of the code, the following are key directions for optimizing this strategy:
-
Dynamic Candle Identification Parameters:
- The current strategy uses fixed values (such as candle height of at least 17 points) to identify effective candles. This could be changed to dynamic parameters based on ATR (Average True Range) to better adapt to different volatility environments.
- Optimization rationale: Fixed parameters perform differently in various volatility environments; dynamic parameters can improve strategy adaptability.
-
Trend Filtering System:
- Add trend determination from higher timeframes (such as 15-minute or 30-minute) to only execute trades in the direction of the main trend or adjust signal weights.
- Optimization rationale: Avoid frequent counter-trend trading in strong trends, improving win rate and risk-reward ratio.
-
Signal Quality Scoring Mechanism:
- Establish a comprehensive scoring system for each trading signal, considering multiple factors such as candle strength, importance of the pivot point touched, RSI value, volume anomalies, etc.
- Optimization rationale: Not all signals are of equal quality; a scoring system can filter out low-quality signals and improve trading efficiency.
-
Capital Management Integration:
- Dynamically adjust position size based on signal strength and market conditions, increasing positions on high-probability opportunities and reducing risk exposure in low-probability situations.
- Optimization rationale: Effective capital management is crucial for long-term profitability and can significantly improve strategy performance.
-
Multiple Timeframe Confirmation:
- Check condition consistency across multiple timeframes before generating signals, for example, trading only when 3-minute and 15-minute chart signals align.
- Optimization rationale: Multiple timeframe confirmation can reduce the probability of false signals and improve trading precision.
-
Stop-Loss and Take-Profit Mechanisms:
- Implement smart stop-loss systems, such as volatility-based dynamic stop-losses or key structural position stop-losses, while setting automatic take-profit targets.
- Optimization rationale: Sound risk management is crucial for avoiding significant drawdowns and protecting profits.
-
Trading Time Filters:
- Identify efficient and inefficient trading sessions, avoiding periods of low market volatility or chaotic periods (such as lunch hours or before and after market open and close).
- Optimization rationale: Market behavior characteristics differ across various sessions; selective trading can improve overall efficiency.
-
Adaptive Indicator Parameters:
- Change fixed technical indicator parameters (such as 14-period RSI, 20-period EMA) to parameters that automatically adjust based on market state.
- Optimization rationale: When market conditions change, optimal indicator parameters should also adjust accordingly, improving indicator sensitivity.
-
Market Environment Classification:
- Add algorithms to automatically identify the current market environment (trending, consolidating, high volatility, etc.) and apply different parameter settings for different environments.
- Optimization rationale: Single parameter settings are difficult to perform optimally in all market environments; environment-adaptive adjustments can significantly enhance strategy stability.
-
Machine Learning Enhancement:
- Consider integrating machine learning models to predict signal success probability, filtering and prioritizing trading signals based on historical pattern recognition.
- Optimization rationale: Machine learning can discover complex patterns difficult for humans to identify, raising the strategy's intelligence level.
By implementing these optimization directions, the strategy can significantly improve adaptability, accuracy, and long-term profitability while maintaining its original advantages, better addressing challenges across various market conditions.
Summary
The Multi-Dimensional Pivot Point Trading System with Dynamic Fibonacci Indicators is a comprehensive, well-structured intraday trading strategy system. It cleverly combines traditional technical analysis tools (pivot points, Fibonacci retracements, moving averages) with modern dynamic indicators (VWAP, CPR). Through strict candle condition screening and multiple indicator confirmation, it provides traders with a promising intraday trading framework.
The core advantage of this strategy lies in its comprehensive coverage of key price levels and sensitive capture of potential reversal points. By setting strict candle identification conditions, the strategy can filter out a large amount of meaningless market noise and focus on high-probability trading opportunities. At the same time, the use of volume and momentum indicators further enhances signal reliability.
However, the strategy also has some limitations, such as potentially excessive signals, contrarian trading risks, and parameter optimization challenges. To address these issues, we've proposed several optimization directions, including dynamic parameter adjustment, multiple timeframe confirmation, intelligent capital management, and market environment adaptation. These optimizations can help traders adjust the strategy according to their own needs and market characteristics, improving overall trading effectiveness.
It's worth noting that no trading strategy is a "magic bullet." Successful trading depends not only on the strategy itself but also on the trader's patience, discipline, and continuous learning. For this strategy, it's recommended that traders first thoroughly test it in a simulated environment, familiarize themselves with its performance characteristics under different market conditions, gradually adjust parameters to adapt to specific trading instruments and personal styles, and ultimately form a personalized, sustainably profitable trading system.
Through continuous practice, feedback, and optimization, the Multi-Dimensional Pivot Point Trading System with Dynamic Fibonacci Indicators can become a powerful weapon in an intraday trader's toolbox, providing a reliable technical analysis framework for capturing short-term market opportunities.
The strategy's integration of traditional pivot points with modern technical tools creates a balanced approach that respects market structure while remaining responsive to intraday price movements. By focusing on key price interactions at critical levels, traders can develop a deeper understanding of market psychology and potentially improve their trading performance.
Ultimately, successful implementation will require thoughtful customization, rigorous testing, and disciplined execution. When properly applied as part of a comprehensive trading plan that includes sound risk management principles, this strategy offers a systematic method for navigating the complexities of intraday markets with greater confidence and precision.
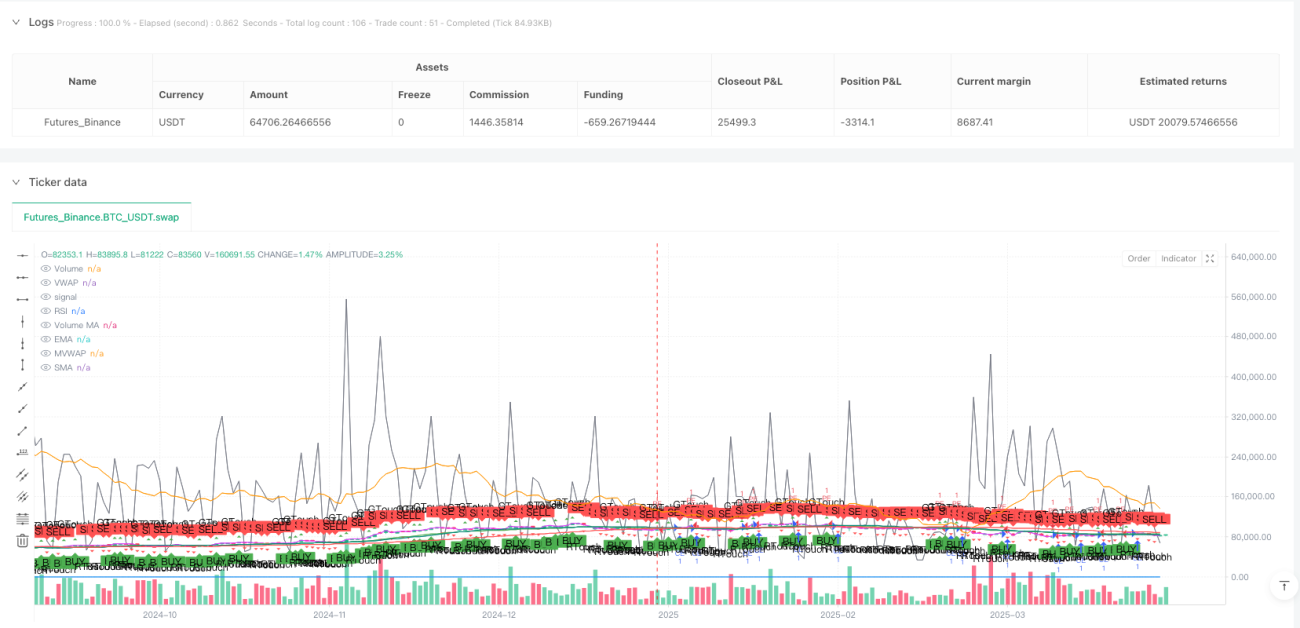
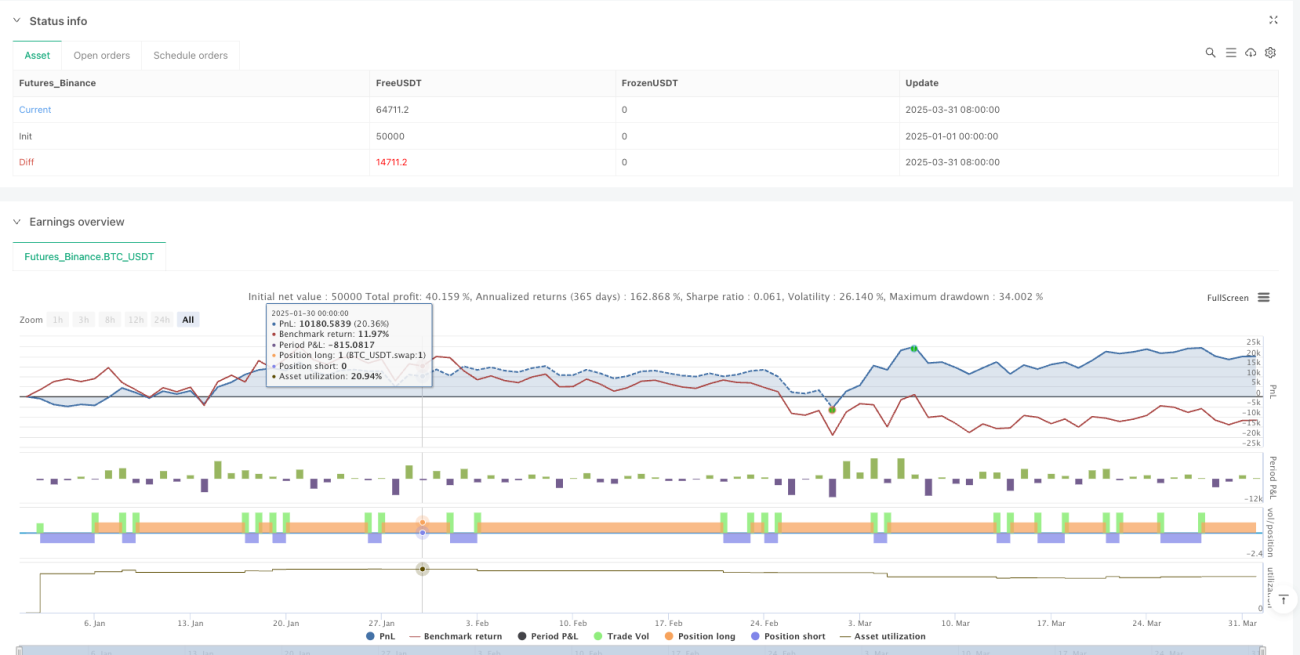
/*backtest
start: 2025-01-01 00:00:00
end: 2025-04-01 00:00:00
period: 1d
basePeriod: 1d
exchanges: [{"eid":"Futures_Binance","currency":"BTC_USDT"}]
*/

//@version=5
strategy("Pivot Point CE/PE Strategy", overlay=true)

// Identify 3-minute candles (Assuming the script is applied to a 3-minute chart)- 1