
সারসংক্ষেপ
মাল্টি-ফ্যাক্টর ALMA-ATR অ্যাডাপ্টিভ ট্রেন্ড ফলোয়িং স্ট্র্যাটেজি হল একটি সমন্বিত ট্রেডিং সিস্টেম যা একাধিক টেকনিক্যাল ইন্ডিকেটর ব্যবহার করে এন্ট্রি ও এক্সিট টাইমিং অপ্টিমাইজ করে। এই স্ট্র্যাটেজির মূল উপাদান হিসেবে ALMA (আর্নো লেগোক্স মুভিং এভারেজ) প্রধান ট্রেন্ড নির্ধারণের টুল হিসেবে ব্যবহৃত হয়, সাথে একীভূত হয়েছে ATR ভোলাটিলিটি ফিল্টার, RSI মোমেন্টাম কনফার্মেশন, ADX ট্রেন্ড শক্তি যাচাইকরণ এবং বোলিঞ্জার ব্যান্ড ভোলাটিলিটি নিয়ন্ত্রণ ব্যবস্থা। এছাড়াও স্ট্র্যাটেজিটিতে UT Bot সিস্টেম সংযুক্ত রয়েছে, যা একটি ATR-ভিত্তিক ট্রেইলিং স্টপ-লস ও সিগন্যাল সিস্টেম এবং ট্রেড এক্সিটের নির্ভুলতা বাড়াতে ব্যবহৃত হয়।
স্ট্র্যাটেজির নীতি
এই স্ট্র্যাটেজির মূল নীতি হল একাধিক টেকনিক্যাল ইন্ডিকেটরের সমন্বিত প্রক্রিয়ার মাধ্যমে এমনভাবে ট্রেড করা যাতে ট্রেন্ড স্পষ্ট এবং ভোলাটিলিটি মাঝারি থাকে। বিশদভাবে:
- প্রধান ট্রেন্ড নির্দেশক হিসেবে ALMA ব্যবহার করা হয়। ALMA ঐতিহ্যবাহী EMA বা SMA-এর তুলনায় মসৃণ এবং কম ল্যাগযুক্ত।
- ভোলাটিলিটি ফিল্টার প্রয়োগ: ATR মান নির্ধারিত ন্যূনতম থ্রেশহোল্ডের উপরে থাকতে হবে, যাতে বাজারে পর্যাপ্ত অস্থিরতা থাকে।
- এন্ট্রি শর্ত: দাম EMA50 এবং ALMA9-এর উপরে থাকতে হবে, RSI ওভারসল্ড স্তরের উপরে এবং 30-এর বেশি হতে হবে, ADX 30-এর বেশি (শক্তিশালী ট্রেন্ড নির্দেশ করে), দাম বোলিঞ্জার ব্যান্ডের উপরের রেখার নিচে থাকতে হবে এবং কুলিং-পিরিয়ড শর্ত পূরণ করতে হবে।
- এক্সিট শর্ত: দাম দ্রুত EMA-এর নিচে নেমে গেলে, বা ATR-ভিত্তিক স্টপ-লস/টেক-প্রফিট ট্রিগার হলে, অথবা সময়ভিত্তিক এক্সিট শর্ত পূরণ হলে।
- UT Bot সিস্টেম সংযুক্ত, যা ATR-ভিত্তিক ট্রেইলিং স্টপ-লস লাইন ব্যবহার করে ট্রেডের জন্য অতিরিক্ত সুরক্ষা ব্যবস্থা প্রদান করে।
স্ট্র্যাটেজিটি গতিশীল ঝুঁকি ব্যবস্থাপনা পদ্ধতি ব্যবহার করে; স্টপ-লস ও টেক-প্রফিট উভয়ই ATR-এর ভিত্তিতে গণনা করা হয়, যা স্ট্র্যাটেজিটিকে বিভিন্ন বাজার পরিস্থিতিতে ভোলাটিলিটির পরিবর্তনের সাথে খাপ খাইয়ে নিতে সহায়তা করে।
সুবিধা বিশ্লেষণ
স্ট্র্যাটেজিটির নিম্নলিখিত উল্লেখযোগ্য সুবিধাগুলি রয়েছে:
- একাধিক নিশ্চিতকরণ ব্যবস্থা: একাধিক টেকনিক্যাল ইন্ডিকেটর (ALMA, RSI, ADX, বোলিঞ্জার ব্যান্ড ইত্যাদি) একীভূত করার মাধ্যমে সিগন্যালের নির্ভরযোগ্যতা বৃদ্ধি পায় এবং ভুয়া সিগন্যাল কমে যায়।
- অভিযোজন ক্ষমতা বেশি: ATR-ভিত্তিক গতিশীল স্টপ-লস ও টেক-প্রফিট স্তর স্ট্র্যাটেজিটিকে বাজারের ভোলাটিলিটির পরিবর্তনের সাথে খাপ খাইয়ে নিতে সক্ষম করে।
- কার্যকরী ট্রেন্ড শনাক্তকরণ: ALMA-র কম ল্যাগ বৈশিষ্ট্য, ADX ট্রেন্ড শক্তি যাচাইয়ের সাথে মিলিত হয়ে ট্রেন্ড পরিবর্তন সময়মতো শনাক্ত করতে সাহায্য করে।
- ঝুঁকি নিয়ন্ত্রণ সম্পূর্ণ: ভোলাটিলিটি ফিল্টার, গতিশীল স্টপ-লস এবং কুলিং-পিরিয়ড ব্যবস্থা মিলিয়ে বহুস্তরীয় ঝুঁকি সুরক্ষা প্রদান করে।
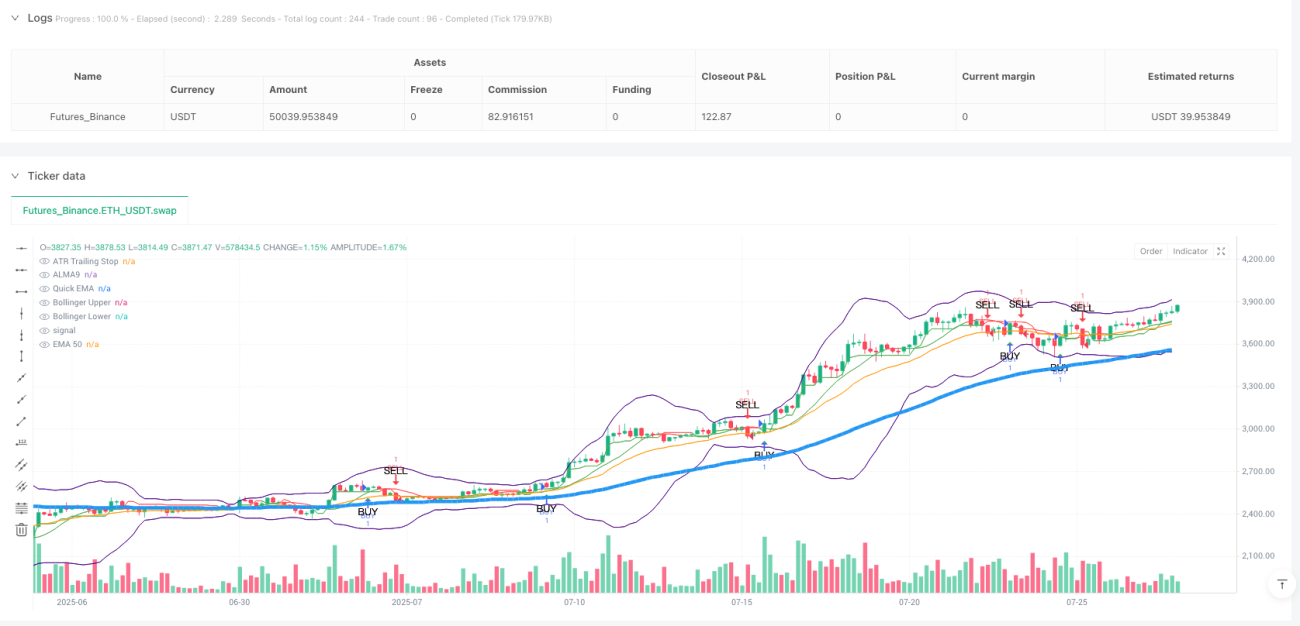
- ভিজুয়ালাইজেশন স্পষ্ট: স্ট্র্যাটেজিটি চার্টে ক্রয় ও বিক্রয় সিগন্যাল চিহ্নিত করে, যা ট্রেডারদের বাজার পরিস্থিতি সহজে বুঝতে সাহায্য করে।
- উচ্চ নমনীয়তা: প্যারামিটার সামঞ্জস্যের মাধ্যমে স্ট্র্যাটেজিটিকে বিভিন্ন বাজার পরিবেশ ও ট্রেডিং সময়সীমার সাথে মানিয়ে নেওয়া যায়।
ঝুঁকি বিশ্লেষণ
স্ট্র্যাটেজিটি তুলনামূলকভাবে সম্পূর্ণ হলেও নিম্নলিখিত সম্ভাব্য ঝুঁকিগুলি বিদ্যমান:
- প্যারামিটার অপ্টিমাইজেশন ঝুঁকি: অতিরিক্ত প্যারামিটার অপ্টিমাইজেশন ঐতিহাসিক ডেটাতে ভালো ফল দেখাতে পারে, কিন্তু বাস্তব ট্রেডিংয়ে তেমন কার্যকর নাও হতে পারে।
সমাধান: ফরোয়ার্ড টেস্টিং এবং আউট-অফ-স্যাম্পল ডেটা ব্যবহার করে প্যারামিটারের দৃঢ়তা নিশ্চিত করা। - ট্রেন্ড রিভার্সাল ঝুঁকি: শক্তিশালী ট্রেন্ড রিভার্সালের সময় স্ট্র্যাটেজিটি যথেষ্ট দ্রুত প্রতিক্রিয়া দেখাতে পারে না, যার ফলে লাভ ফিরে যেতে পারে।
সমাধান: ট্রেন্ড রিভার্সালের পূর্বাভাসের জন্য মোমেন্টাম অসিলেটর বা ভলিউম বিশ্লেষণের মতো সূচক যোগ করার কথা বিবেচনা করা। - অত্যধিক ট্রেডিং ঝুঁকি: সাইডওয়ে বাজারে অতিরিক্ত ট্রেড সিগন্যাল তৈরি হতে পারে।
সমাধান: ভোলাটিলিটি ফিল্টার শর্ত কঠোর করা, অথবা সাইডওয়ে বাজার চিহ্নিত করে ট্রেডিং বন্ধ রাখা। - স্টপ-লস ফাঁদ ঝুঁকি: বাজার স্টপ-লস ট্রিগার হওয়ার পর দ্রুত পূর্বের ট্রেন্ডে ফিরে আসতে পারে।
সমাধান: আংশিক স্টপ-লস কৌশল বা বিভিন্ন বাজার পরিস্থিতির জন্য গতিশীলভাবে স্টপ-লস মাল্টিপ্লায়ার সামঞ্জস্য করার কথা বিবেচনা করা। - ল্যাগ ঝুঁকি: যদিও ALMA-তে ল্যাগ কম, সমস্ত টেকনিক্যাল ইন্ডিকেটরই কিছুটা ল্যাগ ধারণ করে।
সমাধান: ফরোয়ার্ড-লুকিং সূচক যোগ করা বা ALMA প্যারামিটার সেটিংস অপ্টিমাইজ করা।
অপ্টিমাইজেশন দিকনির্দেশনা
স্ট্র্যাটেজি বিশ্লেষণের ভিত্তিতে নিম্নলিখিত অপ্টিমাইজেশন দিকনির্দেশনা প্রস্তাব করা হচ্ছে:
- বাজার অবস্থার শ্রেণিবিন্যাস: বাজার অবস্থা চিহ্নিতকরণ ব্যবস্থা (ট্রেন্ড, সাইডওয়ে, উচ্চ ভোলাটিলিটি ইত্যাদি) প্রবর্তন করে বিভিন্ন অবস্থায় ভিন্ন প্যারামিটার সেটিংস ব্যবহার করা। এটি বিভিন্ন বাজার পরিবেশে স্ট্র্যাটেজির অভিযোজন ক্ষমতা বাড়াবে।
- ভলিউম একীকরণ: ভলিউম সূচককে স্ট্র্যাটেজিতে অন্তর্ভুক্ত করা, ট্রেন্ড নিশ্চিতকরণের সহায়ক হিসেবে, সিগন্যালের নির্ভরযোগ্যতা বাড়াতে পারে।
- মাল্টি-টাইমফ্রেম বিশ্লেষণ: মাল্টি-টাইমফ্রেম নিশ্চিতকরণ ব্যবস্থা চালু করা, যাতে ট্রেডের দিক উচ্চতর টাইমফ্রেমের ট্রেন্ডের সাথে সামঞ্জস্যপূর্ণ থাকে।
- মেশিন লার্নিং অপ্টিমাইজেশন: মেশিন লার্নিং অ্যালগরিদম ব্যবহার করে প্যারামিটার গতিশীলভাবে সামঞ্জস্য করা, অথবা সেরা এন্ট্রি/এক্সিট পয়েন্ট পূর্বাভাস করা।
- টেক-প্রফিট কৌশল উন্নতি: আংশিক টেক-প্রফিট বা বাজার কাঠামোর উপর ভিত্তি করে গতিশীল টেক-প্রফিট বাস্তবায়ন করে মূলধন ব্যবহারের দক্ষতা বাড়ানো।
- সিগন্যাল গুণমান স্কোরিং: সিগন্যাল গুণমান মূল্যায়ন সিস্টেম তৈরি করা, যাতে নির্দিষ্ট থ্রেশহোল্ডের উপরে সিগন্যাল শক্তি থাকলেই কেবল ট্রেড কার্যকর হয়।
- ড্রডাউন নিয়ন্ত্রণ অপ্টিমাইজেশন: সামগ্রিক পজিশন সাইজ নিয়ন্ত্রণ ব্যবস্থা চালু করা, যাতে নির্দিষ্ট ড্রডাউন স্তরের উপরে গেলে পজিশন কমিয়ে দেওয়া বা ট্রেডিং বন্ধ রাখা যায়।
এই অপ্টিমাইজেশন দিকনির্দেশনার লক্ষ্য হল স্ট্র্যাটেজির দৃঢ়তা বৃদ্ধি, ড্রডাউন কমানো এবং বিভিন্ন বাজার পরিবেশে সামঞ্জস্যপূর্ণ কর্মক্ষমতা বজায় রাখা।
উপসংহার
মাল্টি-ফ্যাক্টর ALMA-ATR অ্যাডাপ্টিভ ট্রেন্ড ফলোয়িং স্ট্র্যাটেজি একটি শক্তিশালী, ঝুঁকি নিয়ন্ত্রণে সম্পূর্ণ ট্রেডিং সিস্টেম। ALMA, ATR, RSI, ADX, বোলিঞ্জার ব্যান্ড এবং UT Bot-এর মতো একাধিক টেকনিক্যাল টুল একীভূত করার মাধ্যমে এই স্ট্র্যাটেজিটি কার্যকরভাবে ট্রেন্ড শনাক্ত করতে, শব্দ ফিল্টার করতে, ঝুঁকি নিয়ন্ত্রণ করতে এবং উপযুক্ত সময়ে এন্ট্রি ও এক্সিট করতে সক্ষম। স্ট্র্যাটেজিটির মূল শক্তি হল এর একাধিক নিশ্চিতকরণ ব্যবস্থা এবং অভিযোজিত ঝুঁকি ব্যবস্থাপনা সিস্টেম, যা একে বিভিন্ন বাজার পরিবেশে স্থিতিশীল কর্মক্ষমতা বজায় রাখতে সাহায্য করে।
একথা সত্য যে কোনো ট্রেডিং স্ট্র্যাটেজিই বাজারের অনিশ্চয়তার চ্যালেঞ্জের সম্মুখীন হয়। প্যারামিটার সেটিংস নিয়মিত অপ্টিমাইজ করা, বাজার অবস্থার শ্রেণিবিন্যাস চালু করা, মাল্টি-টাইমফ্রেম বিশ্লেষণ একীভূত করা ইত্যাদি পদ্ধতির মাধ্যমে এই স্ট্র্যাটেজিটির আরও উন্নতির সুযোগ রয়েছে। কোয়ান্টিটেটিভ ট্রেডারদের জন্য এটি একটি ভালো বেসিক ফ্রেমওয়ার্ক স্ট্র্যাটেজি, যা ব্যক্তিগত ঝুঁকি গ্রহণের প্রবণতা ও বাজার বোধ অনুযায়ী আরও কাস্টমাইজ ও অপ্টিমাইজ করা যেতে পারে।
- 1