
3.0 Vorlage: Strichzeichnungsbibliothek
- Die Vorlage ist auf dem Strategieplatz zu sehen.
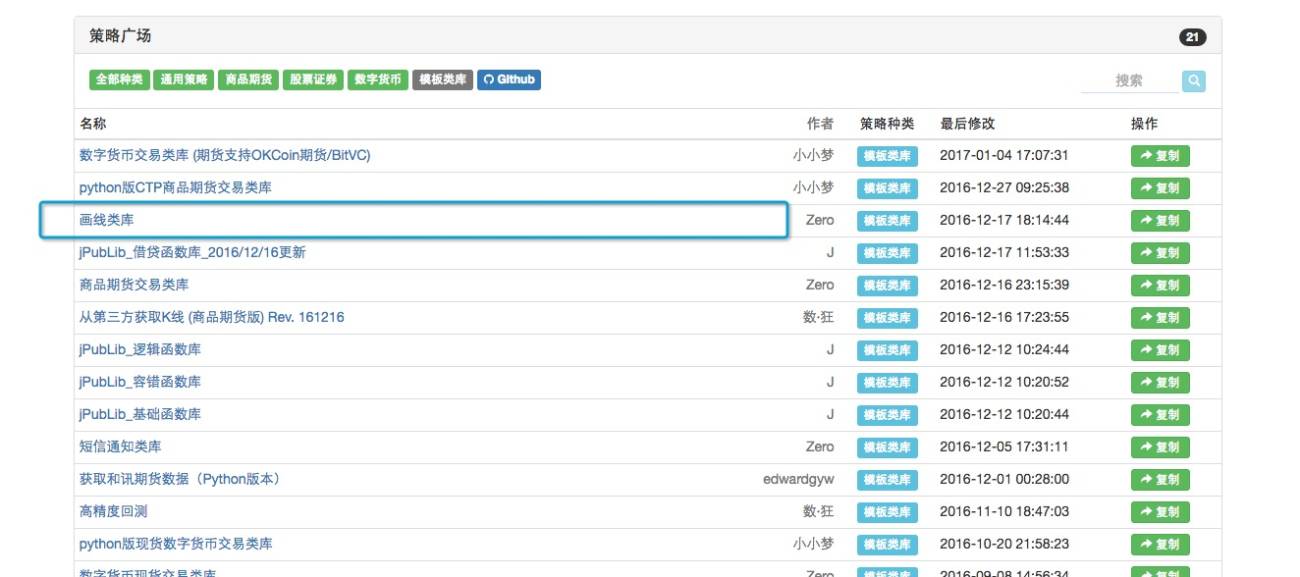
Kommentare und Code:
var chart = null // 一个全局 变量 用来接收 Chart 函数返回的 对象。
var series = [] // 数据系列数组,用来保存 图表上的线、标记、K线等数据。
var labelIdx = [] // label 索引,
var preBarTime = 0 // K线前一柱的 时间戳 ( 毫秒数 )
var preFlagTime = 0 // 前一个 标记 的时间戳
var preDotTime = [] // 时间戳
var cfg = { // 用来初始化设置图表的对象(即图表设置) 具体可见 HighCharts
tooltip: {
xDateFormat: '%Y-%m-%d %H:%M:%S, %A'
},
legend: {
enabled: true,
},
plotOptions: {
candlestick: {
color: '#d75442', // 颜色值
upColor: '#6ba583' // 颜色值
}
},
rangeSelector: { // 范围选择
buttons: [{ // 按钮
type: 'hour',
count: 1,
text: '1h'
}, {
type: 'hour',
count: 3,
text: '3h'
}, {
type: 'hour',
count: 8,
text: '8h'
}, {
type: 'all',
text: 'All'
}],
selected: 2,
inputEnabled: true
},
series: series, // 全局变量赋值给该属性, 注意 数组是引用传递, 即: 浅拷贝。(不明白的可以百度:引用传递)
}
$.GetCfg = function() { // 导出函数 , 用来获取 cfg 对象。
return cfg
}
$.PlotHLine = function(value, label, color, style) { // 画 x 轴 水平线。
if (typeof(cfg.yAxis) === 'undefined') { // 如果 没有定义 y 轴 属性, 添加y轴属性定义。
cfg.yAxis = {
plotLines: [] // y 轴上的 平行于x 轴的 水平线数组。
}
} else if (typeof(cfg.yAxis.plotLines) === 'undefined') { // 如果定义了 y轴 ,没有定义 水平线数组,则添加水平线数组。
cfg.yAxis.plotLines = []
}
/*
Solid
ShortDash
ShortDot
ShortDashDot
ShortDashDotDot
Dot
Dash
LongDash
DashDot
LongDashDot
LongDashDotDot
*/
var obj = { // 定义一个 对象,保存水平线的 各个属性。
value: value, // 在y轴上的 位置值。
color: color || 'red', // 没有传入 默认红色。
width: 2, // 线的宽度是2
dashStyle: style || 'Solid', // 选择线的类型,可以设置为虚线。 'dash'
label: { //
text: label || '',
align: 'center' // 居中显示
},
}
var found = false
for (var i = 0; i < cfg.yAxis.plotLines.length; i++) { // 遍历 水平线这个属性的 数组。
if (cfg.yAxis.plotLines[i].label.text == label) { // 如果找到对应的 label 的水平线
cfg.yAxis.plotLines[i] = obj // 把 obj对象赋值给这个索引 指向的元素。(替换)
found = true // 标记为找到
}
}
if (!found) { // 如果是没找到 (新压入)
cfg.yAxis.plotLines.push(obj)
}
if (!chart) { // 如果 chart 对象是 null
chart = Chart(cfg) // 调用API Chart 初始化图表,返回 对象赋值给chart
} else { // else
chart.update(cfg) // 更新图表
}
}
$.PlotRecords = function(records, title) { // 画K线 ,参数是 K线数据(数组), 标题
var seriesIdx = labelIdx["candlestick"]; // 数据序列 的索引
if (!chart) { // 如果chart 图表对象为 null
chart = Chart(cfg) // 初始化图表,并且返回图表对象给 chart 变量
}
if (typeof(seriesIdx) == 'undefined') { // 如果获取到的数据序列索引 是未定义,执行以下if代码
cfg.__isStock = true // 设置 cfg 对象 __isStock 属性为 true
seriesIdx = series.length // 设置 当前数据序列索引 为 已经存在的索引之后。
series.push({ // 压入series 数据序列数组 ,该数据序列属性如下:
type: 'candlestick', // type 属性 K线图
name: typeof(title) == 'undefined' ? '' : title, // 如果 $.PlotRecords 导出函数调用时,没有传入 title参数,则该数据序列 标题为 空字符串。
id: 'primary', // 数据序列的 id 为 primary (首要的)
data: [] // 数据序列的 数据数组 ,图表上显示的数据值都储存在该数组内。
});
chart.update(cfg) // 用设置过的 cfg 对象 更新 chart 对象。
labelIdx["candlestick"] = seriesIdx // 给 labelIdx (索引的标签) 添加 K线数据序列的索引,即 当前的 seriesIdx 值。
}
if (typeof(records.Time) !== 'undefined') { // 如果传入的是单根 K线 数据执行以下if 代码
var Bar = records; // 把records 赋值给 Bar
if (Bar.Time == preBarTime) { // preBarTime 初始是0, 如果参数传入的records 的时间戳 和 全局变量 preBarTime 相等,即认为当前的Bar (即 records) 没有更新(没有出现新的K线柱)
chart.add(seriesIdx, [Bar.Time, Bar.Open, Bar.High, Bar.Low, Bar.Close], -1) // 根据参数传入的records 更新图表上的 值为 labelIdx["candlestick"] 的数据序列的 倒数第一个数据( 因为 add函数 最后一个参数传入的是 -1)。
} else if (Bar.Time > preBarTime) { // 如果 参数传入的 records 也就是 Bar 的时间戳 比 preBarTime 大,即 新出现了Bar 。
preBarTime = Bar.Time // 更新preBarTime 这个全局变量用于 下次的比较。
chart.add(seriesIdx, [Bar.Time, Bar.Open, Bar.High, Bar.Low, Bar.Close]) // 区别于 Bar.Time == preBarTime 时的操作,没有传参数 -1 ,为在数据序列最后添加一个数据。
}
} else { // 如果传入的是一个K线数据数组, 此情况在第一次 preBarTime = 0 时 ,执行比较特殊:会逐个添加全部 records数据
for (var i = 0; i < records.length; i++) { // 遍历records
if (records[i].Time == preBarTime) { // 如果 索引i 这个元素的时间戳 等于 上一次记录的 preBarTime 更新图表 该数据序列的最后一个数据
chart.add(seriesIdx, [records[i].Time, records[i].Open, records[i].High, records[i].Low, records[i].Close], -1) // 更新
} else if (records[i].Time > preBarTime) { // 如果索引i 这个元素的时间戳大于 preBarTime 则添加
preBarTime = records[i].Time // 更新preBarTime
chart.add(seriesIdx, [records[i].Time, records[i].Open, records[i].High, records[i].Low, records[i].Close]) // 添加
}
}
}
return chart // 返回 chart
}
$.PlotLine = function(label, dot, time) { // 画线
if (!chart) { // 如果 chart 为 null 执行以下
cfg.xAxis = { // 设置 cfg对象 x轴 的类型为 datatime 时间类型
type: 'datetime'
}
chart = Chart(cfg) // 调用 Chart 这个API函数(cfg为参数) 初始化图表
}
var seriesIdx = labelIdx[label] // 按照 label参数获取 标签索引 赋值给 数据序列索引。
if (typeof(seriesIdx) === 'undefined') { // 如果 labelIdx 内没有 参数传入的 label 这个标签的索引 执行以下代码 添加这个数据序列
seriesIdx = series.length // 根据已有的数据序列的长度,赋值 新数据序列的索引
preDotTime[seriesIdx] = 0 // 在线条的 前一个值(preDotTime中的元素) 使用了一个数组储存(因为可能有多个线条,所以会有多个 “前一个值” ,所以用数组储存,这个“前一个值”作用类似于 preBarTime)
labelIdx[label] = seriesIdx; // 把当前标签 对应的索引 储存在标签索引。
series.push({ // 把数据序列 push 进 数据序列数组
type: 'line', // 设置当前的数据序列 类型为: 线
yAxis: 0, // 使用的y轴 为索引为 0 的y轴(highcharts 图表 可以有 多个 y 坐标轴,这里指定索引0的y轴)
showInLegend: true, //
name: label, // 根据 函数传入的 参数 label 设置
data: [], // 数据序列的数据项
tooltip: { // 工具提示
valueDecimals: 5 // 值的小数点 保留5位
}
})
chart.update(cfg) // 用cfg 对象 更新图表对象 chart
}
if (typeof(time) == 'undefined') { // 如果参数没有传入 要画线(其实是线上的点)的时间。
time = new Date().getTime() // 给形参 time 赋值当前的时间戳
}
if (preDotTime[seriesIdx] != time) { // 对比当前时间如果不等于执行if 内的代码
preDotTime[seriesIdx] = time // 更新 上一次时间
chart.add(seriesIdx, [time, dot]) // 添加参数传进的点 在x轴值为 time 的时间上
} else {
chart.add(seriesIdx, [time, dot], -1) // 如果时间相等 ,则更新数据序列的最后的点
}
return chart // 返回图表对象
}
$.PlotFlag = function(time, text, title, shape, color) { // 在图表上添加 旗帜标签
if (!chart) { // 如果 chart 为 null
chart = Chart(cfg) // 初始化 图表
}
label = "flag"; // 设置标签类型为 flag (旗帜)
var seriesIdx = labelIdx[label] // 在数据序列索引数组中获取 旗帜 类型的索引
if (typeof(seriesIdx) === 'undefined') { // 如果没有该索引
seriesIdx = series.length // 根据现有的索引数组长度 新设置一个索引
labelIdx[label] = seriesIdx; // 储存该索引 到标签索引数组
series.push({ // 向数据序列数组 压入 当前数据序列
type: 'flags', // 设置当前压入的数据序列 类型为 旗帜类型
onSeries: 'primary', // 设置 旗帜标记在哪个数据序列上, 这里设置 标记在 id 为 primary的数据序列上(即 K线数据序列)
data: [] // 数据序列的 数据项
})
chart.update(cfg) // 更新图表对象
}
var obj = { // 根据函数参数 初始化一个对象 用来 加载到图表。
x: time, // x轴的值, 即时间戳
color: color, // 颜色
shape: shape, // 形状
title: title, // 标题
text: text // 文本
}
if (preFlagTime != time) { // 上一次的标记时间 如果不等于当前时间
preFlagTime = time // 更新上一次的标记时间
chart.add(seriesIdx, obj) // 用设置好的obj对象添加该标记(写入图表)
} else {
chart.add(seriesIdx, obj, -1) // 如果时间相同,则更新最后一个旗帜标记。
}
return chart // 返回图表对象
}
$.PlotTitle = function(title, chartTitle) { // 设置 图表 标题
cfg.subtitle = { // 根据参数 title设置子标题
text: title
};
if (typeof(chartTitle) !== 'undefined') { // 如果 chartTitle 不等于 未定义,即传入了值
cfg.title = { // 设置 图表标题
text: chartTitle // 文本为 chartTitle
};
}
if (chart) { // 如果 图表已经初始化,更新图表
chart.update(cfg)
}
}
// 测试代码
function main() {
var isFirst = true // 设置一个变量 表示第一次循环
while (true) {
var records = exchange.GetRecords(); // 获取K线数据
if (records && records.length > 0) { // records 不为 null 并且 不是 空数组
$.PlotRecords(records, 'BTC') // 调用 模板导出函数 $.PlotRecords 传入 K线数据 和 标题 BTC
if (isFirst) { // 如果是第一次循环 执行以下
$.PlotFlag(records[records.length - 1].Time, 'Start', 'S') // 添加一个 旗帜标记
isFirst = false // 更新isFirst 下次不会在执行符合当前 if 条件的代码
$.PlotHLine(records[records.length - 1].Close, 'Close') // 画一条水平线
}
}
var ticker = exchange.GetTicker() // 获取行情信息
if (ticker) { // 行情信息 获取成功 不为 null
$.PlotLine('Last', ticker.Last) // 画出此刻 最后成交价在线上的点
$.PlotLine('buy', ticker.Buy + 10) // 画出此刻 买一价在线上的点
$.PlotTitle('Last ' + ticker.Last) // 在标的上实时显示 “最后成交价”标题 和 对应的数据
}
Sleep(60000)
}
}
-
Die Vorlage selbst wurde getestet:
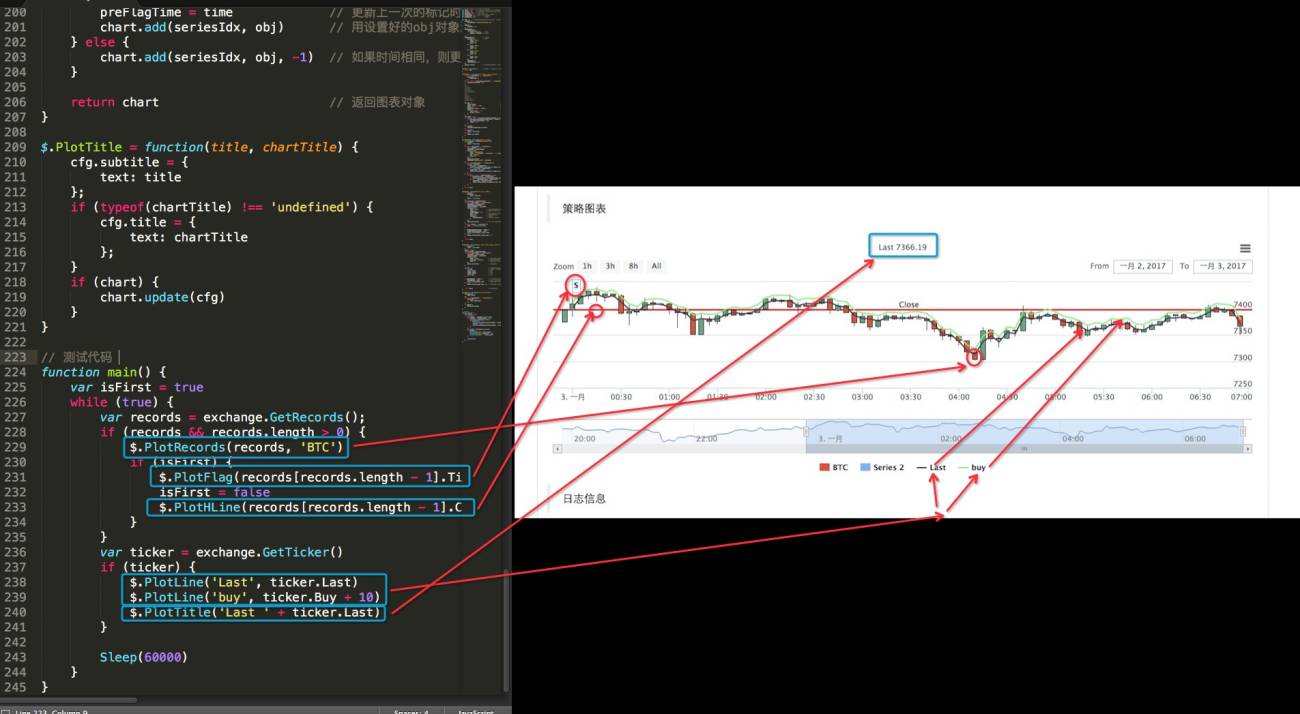
-
In Testcode wird die Template-Export-Funktion aufgerufen:
-
$.PlotRecords(records, 'BTC')
// Schreibe in die Grafik K-Zeilen, die als records eingestuft werden, entweder als bar oder als array -
$.PlotFlag(records[records.length - 1].Time, 'Start', 'S')
// Hinzufügen von Flaggen mit folgenden Parametern: Zeitleiste, Text im Tag, Titel -
$.PlotHLine(records[records.length - 1].Close, 'Close')
// Hinzufügen einer horizontalen Linie mit den Parametern: y-Achsenwert, Text auf der horizontalen Linie -
$.PlotLine('buy', ticker.Buy + 10)
// Fügen Sie eine Kurve hinzu, die die Parameter: Tag-Name, Wert der Kurve auf der y-Achse in der aktuellen Zeit enthält. -
$.PlotTitle('Last ' + ticker.Last)
// Benutzerdefinierte Titelinhalte
-
Es ist einfach zu bedienen, also beeilen Sie sich, es zu versuchen!


- 1