Beste Supertrendstrategie
Schriftsteller:ChaoZhang, Datum: 2023-09-09 22:18:31Tags:
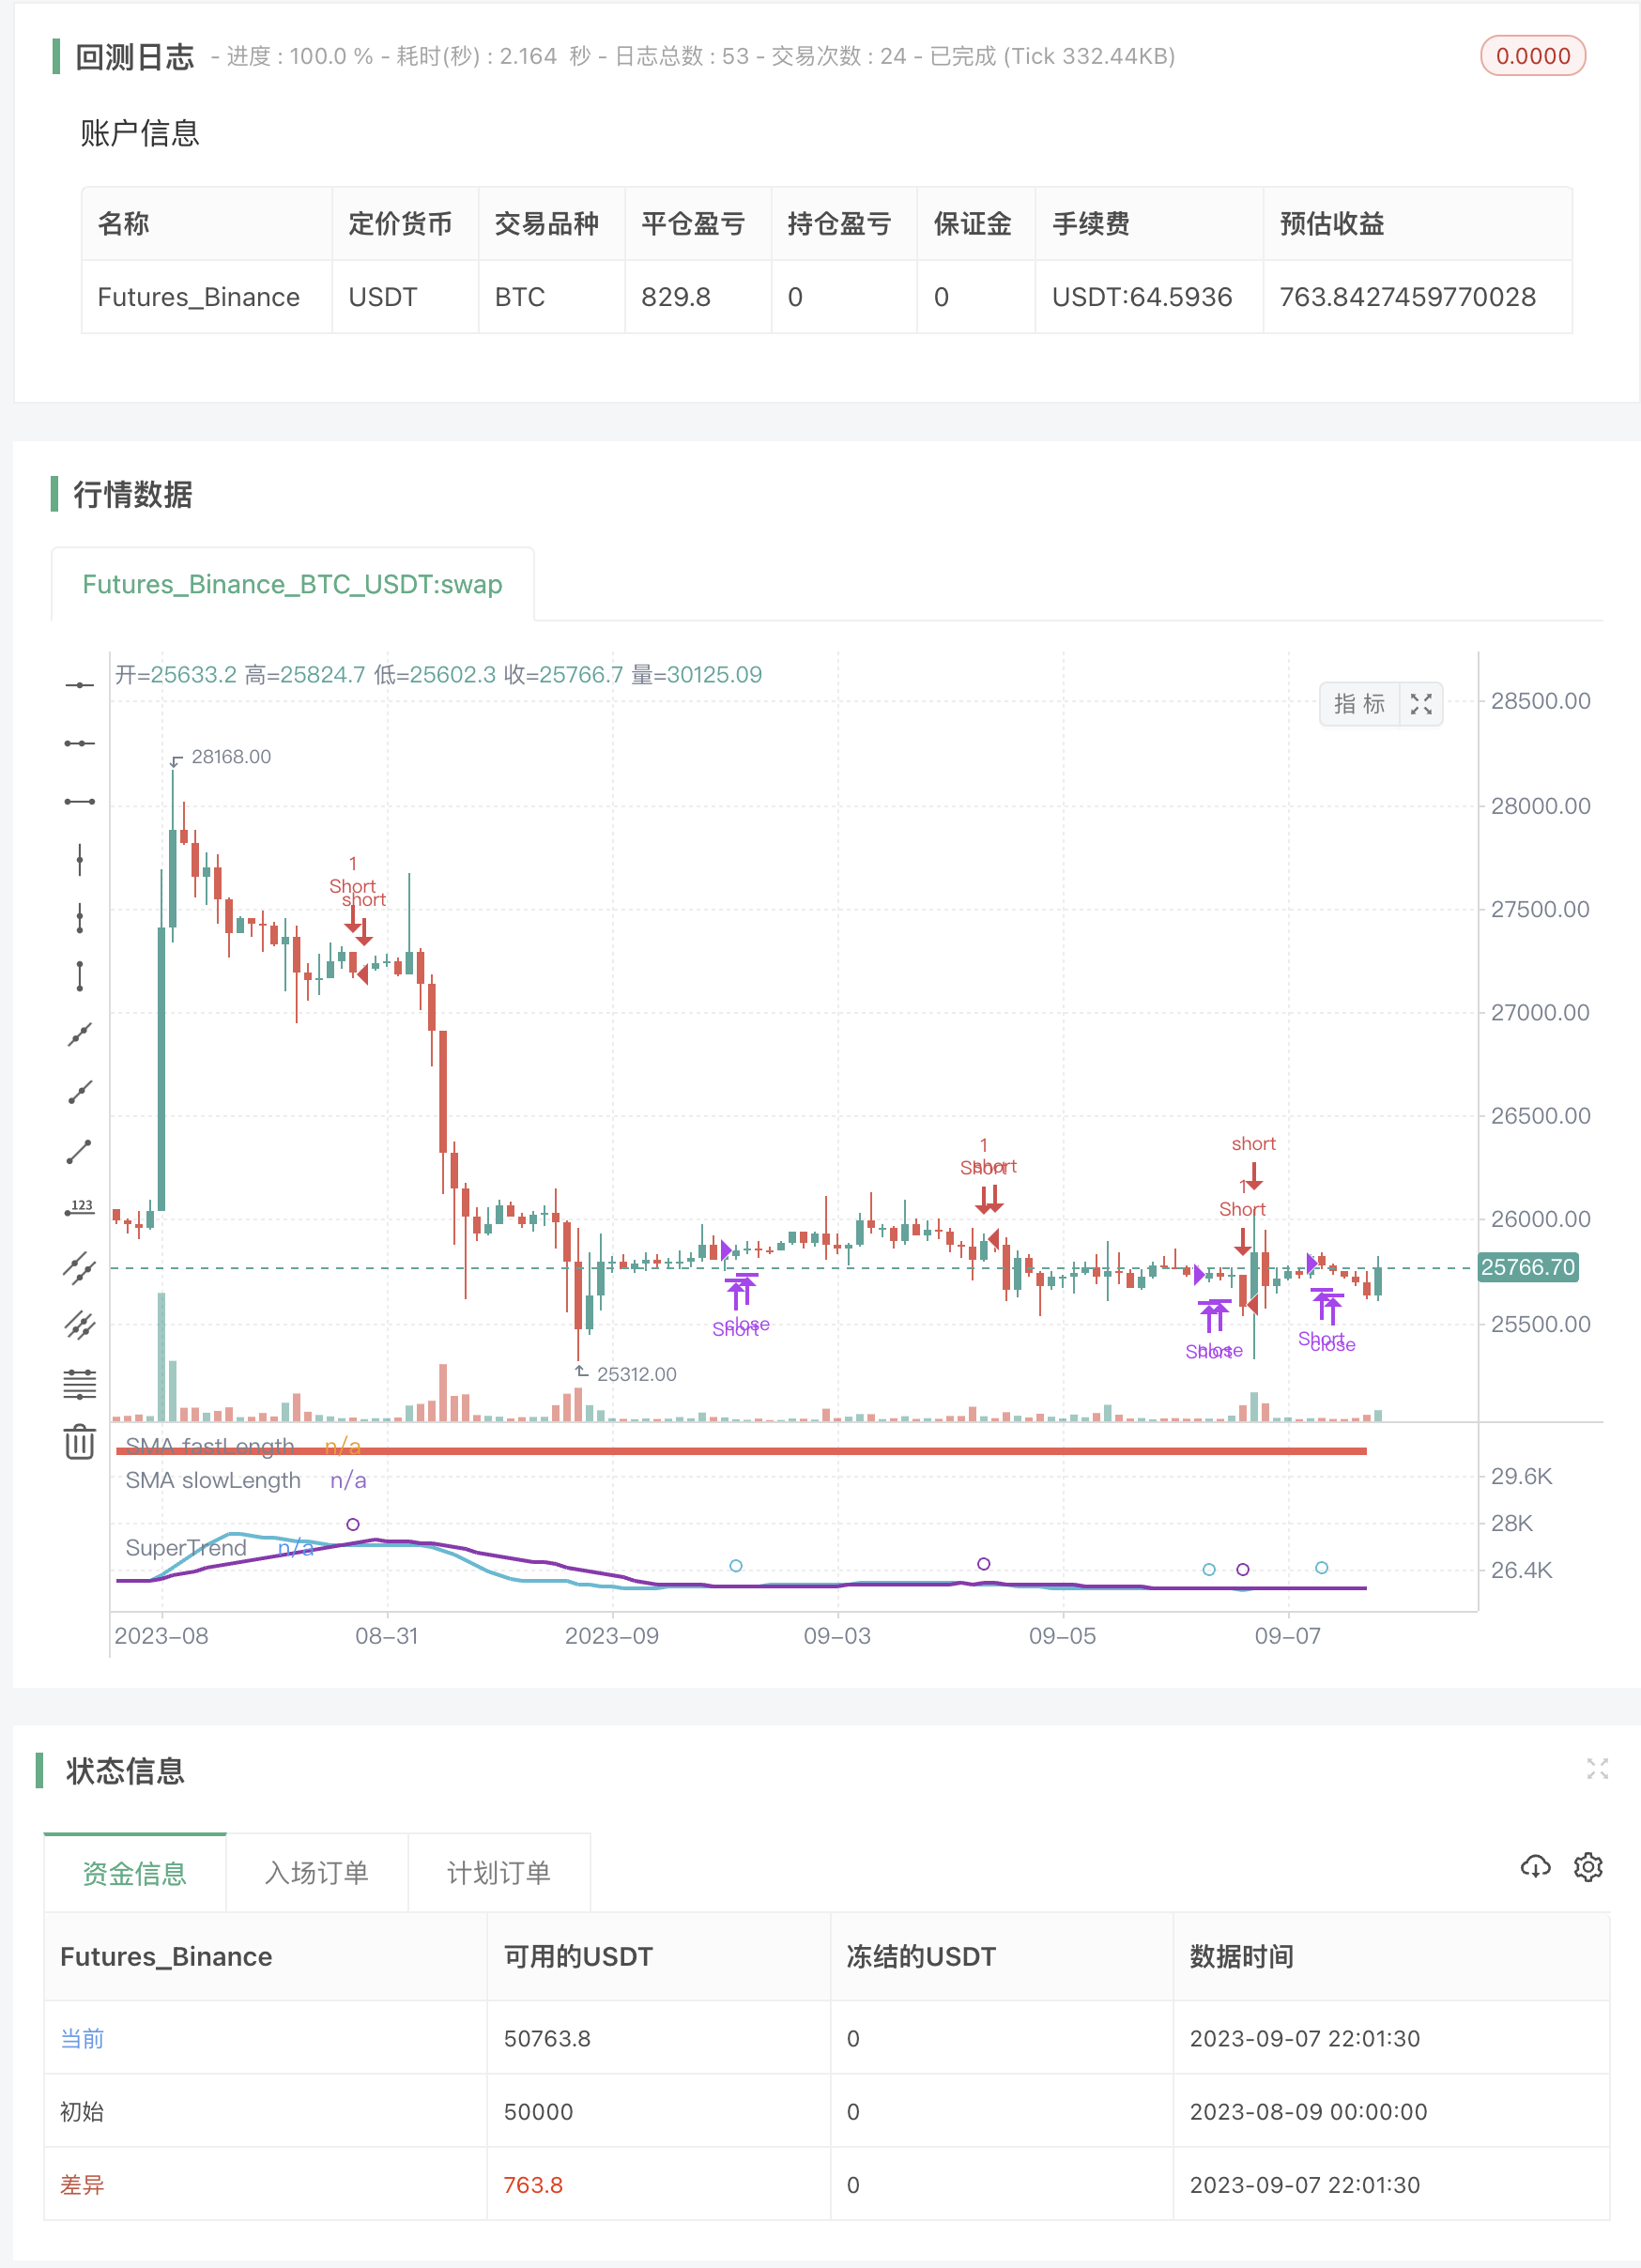 Die Supertrend-Strategie ist eine einfache und effektive Handelsstrategie, die verwendet werden kann, um sowohl von den Auftrend- als auch Abwärtstrendmärkten zu profitieren.
Die BEST Supertrend Strategie ist eine Modifikation der Standard-Supertrend-Strategie, die einen höheren Faktor und eine höhere Periode verwendet.
Die Strategie funktioniert, indem man lange Trades eingeht, wenn der Preis über die Supertrend-Linie bricht und lange Trades beendet, wenn der Preis unter die Supertrend-Linie bricht. Kurze Trades werden eingegeben, wenn der Preis unter die Supertrend-Linie bricht und beendet, wenn der Preis über die Supertrend-Linie bricht.
Die BEST Supertrend Strategie ist eine einfache und effektive Strategie, die von Handlern aller Erfahrungsstufen verwendet werden kann.
Hier sind einige der Vorteile der BEST Supertrend Strategie:
Einfach und leicht verständlich Wirksam sowohl auf Aufwärtstrend- als auch auf Abwärtstrendmärkten Niedriges Risiko Gewinnbringend Wenn Sie nach einer einfachen und effektiven Handelsstrategie suchen, ist die BEST Supertrend Strategy eine großartige Option. Die Strategie ist leicht zu erlernen und zu verwenden und hat das Potenzial, Gewinne sowohl auf Auf- als auch auf Abwärtstrendmärkten zu erzielen.
Hier sind einige Tipps zur Verwendung der BEST Supertrend Strategie:
Verwenden Sie einen hohen Faktor und eine hohe Periode, um den Indikator empfindlicher auf Veränderungen des Trends auszurichten. Verwenden Sie Stop-Losses, um Verluste zu begrenzen. Handel mit einer kleinen Größe, um das Risiko zu managen. Testen Sie die Strategie auf historische Daten, um zu sehen, wie sie funktioniert. Die BEST Supertrend Strategie ist eine großartige Möglichkeit, mit dem Handel zu beginnen. Es ist eine einfache und effektive Strategie, die von Handlern aller Erfahrungsniveaus verwendet werden kann. Wenn Sie nach einer Möglichkeit suchen, von den Märkten zu profitieren, ist die BEST Supertrend Strategie eine gute Option.
/*backtest
start: 2023-08-09 00:00:00
end: 2023-09-08 00:00:00
period: 2h
basePeriod: 15m
exchanges: [{"eid":"Futures_Binance","currency":"BTC_USDT"}]
args: [["v_input_4",2]]
*/

//@version=4
//@author=Daveatt

// strategy(title="BEST Supertrend Strategy", shorttitle="Supertrend Strategy", overlay=true,
//  pyramiding=0, default_qty_value=100, precision=7, currency=currency.USD,
//  commission_value=0.2,commission_type=strategy.commission.percent, initial_capital=1000000)


///////////////////////////////////////////////////////////////////////////////
///////////////////////////////////////////////////////////////////////////////
/////////////////////////// Strategy Component /////////////////////////////////
///////////////////////////////////////////////////////////////////////////////
///////////////////////////////////////////////////////////////////////////////

orderType = input("Longs+Shorts",title="What type of Orders", options=["Longs+Shorts","LongsOnly","ShortsOnly"])
isLong   = (orderType != "ShortsOnly")
isShort  = (orderType != "LongsOnly")

// SMA
fastLength = input(7, title="Fast Length SMA")
slowLength = input(20, title="Slow Length SMA")

///////////////////////////////////////////////////////////////////////////////
///////////////////////////////////////////////////////////////////////////////
///////////////////////////// SUPERTREND /////////////////////////////////////
///////////////////////////////////////////////////////////////////////////////
///////////////////////////////////////////////////////////////////////////////

Factor=input(3,title="[ST] Factor", minval=1,maxval = 100, type=input.float)
Pd=input(3, title="[ST] PD", minval=1,maxval = 100)
TF=input("daily", title="Supertrend timeframe", options=["daily","weekly","monthly","quartly","yearly"])

//////////////////////////
//* COLOR CONSTANTS *//
//////////////////////////

AQUA = #00FFFFFF
BLUE = #0000FFFF
RED  = #FF0000FF
LIME = #00FF00FF
GRAY = #808080FF
DARKRED   = #8B0000FF
DARKGREEN = #006400FF
GOLD = #FFD700
WHITE = color.white

// Plots
GREEN_LIGHT     = color.new(color.green, 40)
RED_LIGHT       = color.new(color.red, 40)
BLUE_LIGHT      = color.new(color.aqua, 40)
PURPLE_LIGHT    = color.new(color.purple, 40)


///////////////////////////////////////////////////////////////////////////////
///////////////////////////////////////////////////////////////////////////////
/////////////////////// SUPERTREND DETECTION //////////////////////////////////
///////////////////////////////////////////////////////////////////////////////
///////////////////////////////////////////////////////////////////////////////

f_supertrend(Factor, Pd) =>

    Up=hl2-(Factor*atr(Pd))
    Dn=hl2+(Factor*atr(Pd))

    TrendUp = 0.0
    TrendUp := close[1]>TrendUp[1] ? max(Up,TrendUp[1]) : Up
    TrendDown = 0.0
    TrendDown := close[1]<TrendDown[1]? min(Dn,TrendDown[1]) : Dn
    Trend = 0.0
    Trend := close > TrendDown[1] ? 1: close< TrendUp[1]? -1: nz(Trend[1],1)
    Tsl = Trend==1? TrendUp: TrendDown

    Tsl

st_tsl = f_supertrend(Factor, Pd)

///////////////////////////////////////////////////////////////////////////////
///////////////////////////////////////////////////////////////////////////////
////////////////////////// MULTI TIMEFRAMES CALCS /////////////////////////////
///////////////////////////////////////////////////////////////////////////////
///////////////////////////////////////////////////////////////////////////////


f_securitys(_ticker, _source)=>

    daily = security(_ticker, 'D', _source[1], lookahead=true)
    weekly = security(_ticker, 'W', _source[1], lookahead=true)
    montly = security(_ticker, 'M', _source[1], lookahead=true)
    quarterly = security(_ticker, '3M', _source[1], lookahead=true)
    yearly = security(_ticker, '12M', _source[1], lookahead=true)

    [daily, weekly, montly, quarterly, yearly]


[st_daily, st_weekly, st_monthly, st_quarterly, st_yearly] = f_securitys(syminfo.tickerid, st_tsl)

lapos_x = timenow + round(change(time)*50)
lapos_y = close

down_arrows_text = "▼" + " " + "▼" + " " + "▼" + " " + "▼" + " " + "▼" + " " + "▼" + " " + "▼" + "\n"

// Drawing function designed by RicardoSantos.
f_draw_infopanel(_x, _y, _color, _line, _text)=>
    _rep_text = ""
    for _l = 0 to _line
        _rep_text := _rep_text + "\n"
    _rep_text := _rep_text + _text

    var label _la = na
    label.delete(_la)
    _la := label.new(x=_x, y=_y, text=_rep_text, xloc=xloc.bar_time, yloc=yloc.price,
     color=#C1CADE,  textcolor=_color, size=size.normal)

// Using the JustUncleL reverse order trick
f_draw_infopanel(lapos_x, lapos_y, color.olive,                 12, "╚═══════════════════════╝")
f_draw_infopanel(lapos_x, lapos_y, color.new(color.red, 20),    10,  "Yearly : " + tostring(round(st_yearly)))
f_draw_infopanel(lapos_x, lapos_y, color.new(color.purple, 20), 8,  "Quarterly : " + tostring(round(st_quarterly)))
f_draw_infopanel(lapos_x, lapos_y, color.new(color.green, 20),  6,  "Monthly : " + tostring(round(st_monthly)))
f_draw_infopanel(lapos_x, lapos_y, color.new(color.blue, 20),   4,  "Weekly : " +  tostring(round(st_weekly)))
f_draw_infopanel(lapos_x, lapos_y, color.new(color.green, 20),  2,  "Daily : " +  tostring(round(st_daily)))
f_draw_infopanel(lapos_x, lapos_y, color.olive,                 0,  "╔═════ Supertrend (" + tostring(Factor) + "," + tostring(Pd) + ") ═════╗")

IS_DAILY = TF == "daily"
IS_WEEKLY = TF == "weekly"
IS_MONTHLY = TF == "monthly"
IS_QUARTERLY = TF == "quarterly"
IS_YEARLY = TF == "yearly"

// select right supertrend
st_tsl_TF = iff(IS_DAILY, st_daily,
 iff(IS_WEEKLY, st_weekly,
 iff(IS_MONTHLY, st_monthly,
 iff(IS_QUARTERLY, st_quarterly,
 iff(IS_YEARLY, st_yearly, st_daily)))))


// hard exit
sma_fast = sma(close, fastLength)
sma_slow = sma(close, slowLength)
long_exit     = crossunder(sma_fast,sma_slow)
short_exit    = crossover(sma_fast,sma_slow)

// MA Cross
curr = 0 - barssince(long_exit) + barssince(short_exit)
cross_buy = curr < 0 ?  1 : 0
cross_sell = curr > 0 ? 1  : 0

bull = close >= st_tsl_TF and cross_buy
bear = close <= st_tsl_TF and cross_sell
entry_price = valuewhen(bull or bear, close, 0)

plot(sma_fast, "SMA fastLength", color=color.aqua, linewidth=2)
plot(sma_slow, "SMA slowLength", color=color.purple, linewidth=2)
plotshape(crossover(sma_fast,sma_slow), color=color.aqua, style=shape.circle, size=size.small)
plotshape(crossunder(sma_fast,sma_slow), color=color.purple, style=shape.circle, size=size.small)

// Plot the ST
linecolor = close >= st_tsl_TF ? color.green : color.red
plot(st_tsl_TF, color = linecolor , linewidth = 4,title = "SuperTrend", transp=0)

// Strategy entries/exits
if isLong
    strategy.entry("Long", 1, when=bull)
    strategy.close("Long", when=long_exit)

if isShort
    strategy.entry("Short", 0,  when=bear)
    strategy.close("Short", when=short_exit )
- Aufwärtstrend- und Überverkauft-Index-Swing-Handelssystemstrategie
- Quantitative Trend-Handelsstrategie mit Polynomialregression
- Kombo Backtest 123 Umkehrung und Relativer Volatilitätsindex
- Die SMA-3-Handelsstrategie
- Die Bollinger-Band-Automatisierte Handelsstrategie
- Die Genesis-Crossover-Handelstrategie
- Die Gunbot-Bands-Strategie
- Strategie für den Handel mit Paaren
- Die Strategie für einen offenen Bereich mit dynamischem Gewinnziel
- Umschlagstrategie in Gang setzen
- Umkehrsystem
- Adaptive Nullverzögerung EMA-Strategie
- Die ICHIMOKU-Wolke von BV - Alle Signale
- Strategie für den Relative Strength Index
- Bollinger-Bänder + EMA 9
- Einfache EMA20-Strategie + Stochastik
- NTPCVerzögerung des UDP-Clients und des Exchange-Servers
- VWMA + SMA Bollinger Bands + RSI-Strategie: Analyse der Korrelation zwischen Preis und Volumen
- EMA200 und Stochastische RSI-Strategie
- Trade05-K-Leitung unterstützt Widerstand + ATR-Stopp