Dreifache Bollinger-Bänder Standardabweichung Trendfolgestrategie

Überblick
Die Strategie ist ein auf der Brin-Band-Standarddifferenz basierendes Trend-Tracking-Trading-System. Die Strategie beurteilt die Stärke des Trends durch die Beobachtung der positiven Beziehung von drei aufeinanderfolgenden Wurzeln zum Abstieg des Brin-Bands und handelt, wenn der Trend feststeht. Das System verwaltet das Risiko für jeden Handel mit einem festen Risiko-Gewinn-Verhältnis.
Strategieprinzip
Die Kernlogik der Strategie basiert auf den folgenden Punkten:
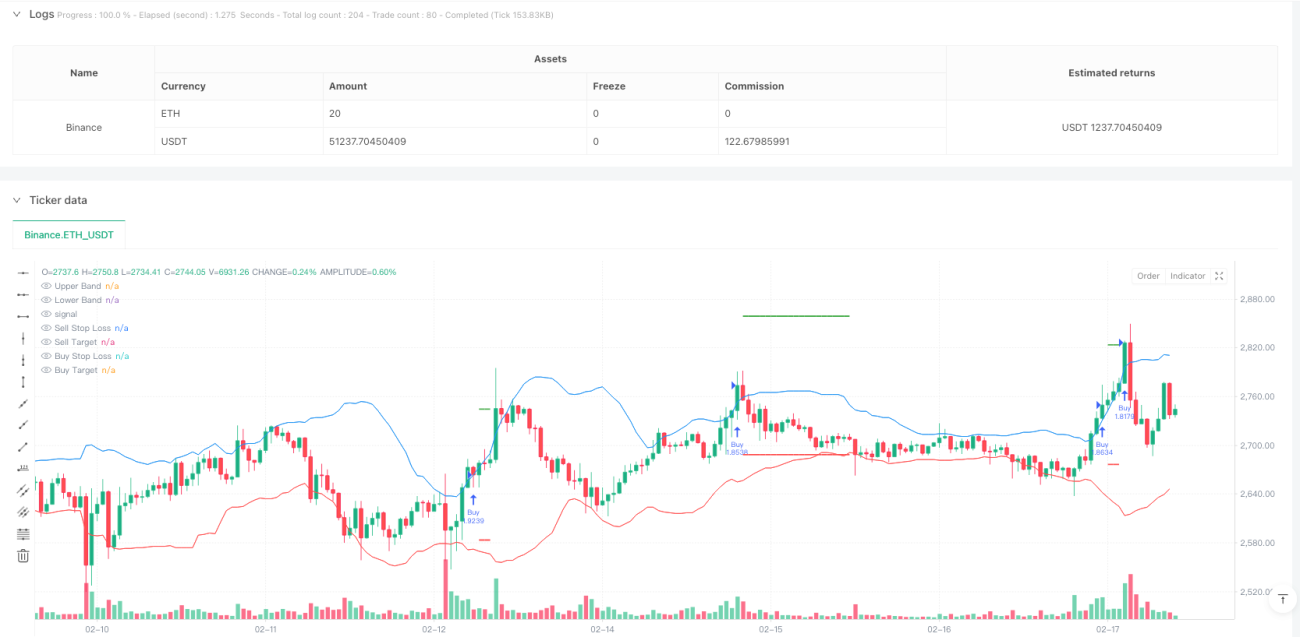
- Der 20-Perioden-Moving-Average wird als Mittelstraße für die Brin-Band verwendet, und die doppelte Standardabweichung wird auf und ab berechnet.
- Wenn die Schlusskosten von drei aufeinanderfolgenden Wurzeln über der Oberbahn liegen, hält das System den Aufwärtstrend für etabliert und tritt bei der Schließung der dritten Wurzel mehr ein.
- Wenn die Schlusskosten von drei aufeinanderfolgenden Wurzeln unterhalb der Unterbahn liegen, wird der Abwärtstrend als festgestellt angesehen und bei der Schließung des dritten Wurzels wird ein Leerlauf eingeleitet.
- Der Stoppschaden wird auf den Maximalwert des ersten Signals eingestellt.
- Die Zielpreise werden mit einem Risiko-Gewinn-Verhältnis von 1:1, d. h. mit einem Ziel-Gewinn-Radius von 1:1, festgelegt.
Strategische Vorteile
- Die Signalbestätigungsmechanismen sind robust - drei aufeinanderfolgende Kabel werden benötigt, um den Brin-Band zu durchbrechen, was die Gefahr eines falschen Durchbruchs reduziert.
- Risikomanagement ist vernünftig - Handel wird mit einem festen Risiko-Gewinn-Verhältnis verwaltet, um übermäßige Verluste bei einzelnen Geschäften zu vermeiden.
- Der Trend-Tracking-Effekt ist bemerkenswert - die Standard-Deviance-Eigenschaft der Brin-Band ermöglicht es der Strategie, sich an die Veränderungen der Marktfluktuation anzupassen.
- Die Ausführungsregeln sind eindeutig - die Einstellung von Einstiegs-, Stop-Loss- und Gewinnzielen hat eindeutige Quantifizierungsstandards und erfordert keine subjektive Beurteilung.
Strategisches Risiko
- Schlechte Leistung des Horizontalmarktes - häufige falsche Signale können in einem Markt ohne deutliche Trends erzeugt werden.
- Die Eintrittszeiten sind etwas verspätet - es ist notwendig, auf die Bestätigung der drei Anschlüsse zu warten, um die Eintrittszeiten zu erhalten, und es ist möglich, dass einige der frühen Phasen der Eintrittszeiten verpasst werden.
- Einschränkung des Risikogewinn-Risiko-Verhältnisses - ein 1:1-Risiko-Gewinn-Verhältnis kann bei starken Trends zu früh zum Gewinn führen.
- Fehlende Filterung der Trendstärke - nur die Preis-Brin-Beziehung wird beurteilt, andere Trendbestätigungsindikatoren werden nicht berücksichtigt.
Richtung der Strategieoptimierung
- Erhöhung der Trendstärkenfilter - Trendindikatoren wie ADX oder MACD können eingeführt werden, um die Signalqualität zu verbessern.
- Optimierte Risikosatz-Einstellungen - die Risikosatz-Einstellungen können an die dynamischen Marktschwankungen angepasst werden.
- Verbesserte Stop-Off-Mechanismen - Erwägen Sie die Möglichkeit, mehr mobile Stop-Off-Mechanismen zu verwenden, um Trends besser zu erfassen.
- Hinzufügung der Transaktionsdatenbestätigung - Erhöhung der Transaktionsdatenbestätigung bei der Signalerzeugung, um die Signalsicherheit zu erhöhen.
Zusammenfassen
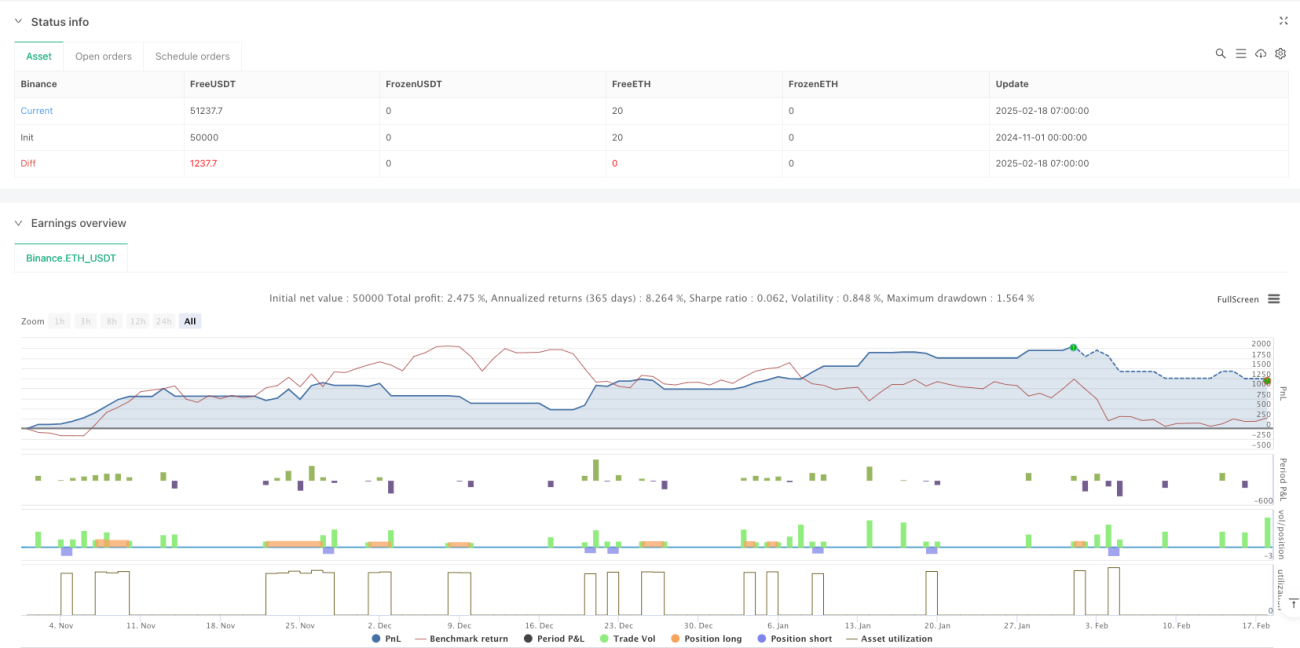
Dies ist eine vernünftige Trend-Tracking-Strategie, die Markttrends durch Brin-Bands und Multiple-Confirmation-Mechanismen erfasst. Das Risikomanagement-Framework für die Strategie ist perfekt, die Standards für die Umsetzung sind klar. Obwohl es einige Rückstände gibt, kann die Stabilität und Profitabilität der Strategie durch die empfohlene Optimierungsrichtung weiter verbessert werden.
/*backtest
start: 2024-11-01 00:00:00
end: 2025-02-18 08:00:00
period: 1h
basePeriod: 1h
exchanges: [{"eid":"Binance","currency":"ETH_USDT"}]
*/

//@version=6
strategy("Bollinger Band Buy and Sell Strategy (Entry at Close of 3rd Candle)", overlay=true, default_qty_type=strategy.percent_of_equity, default_qty_value=10, pyramiding=0)

// Bollinger Band settings- 1