概述
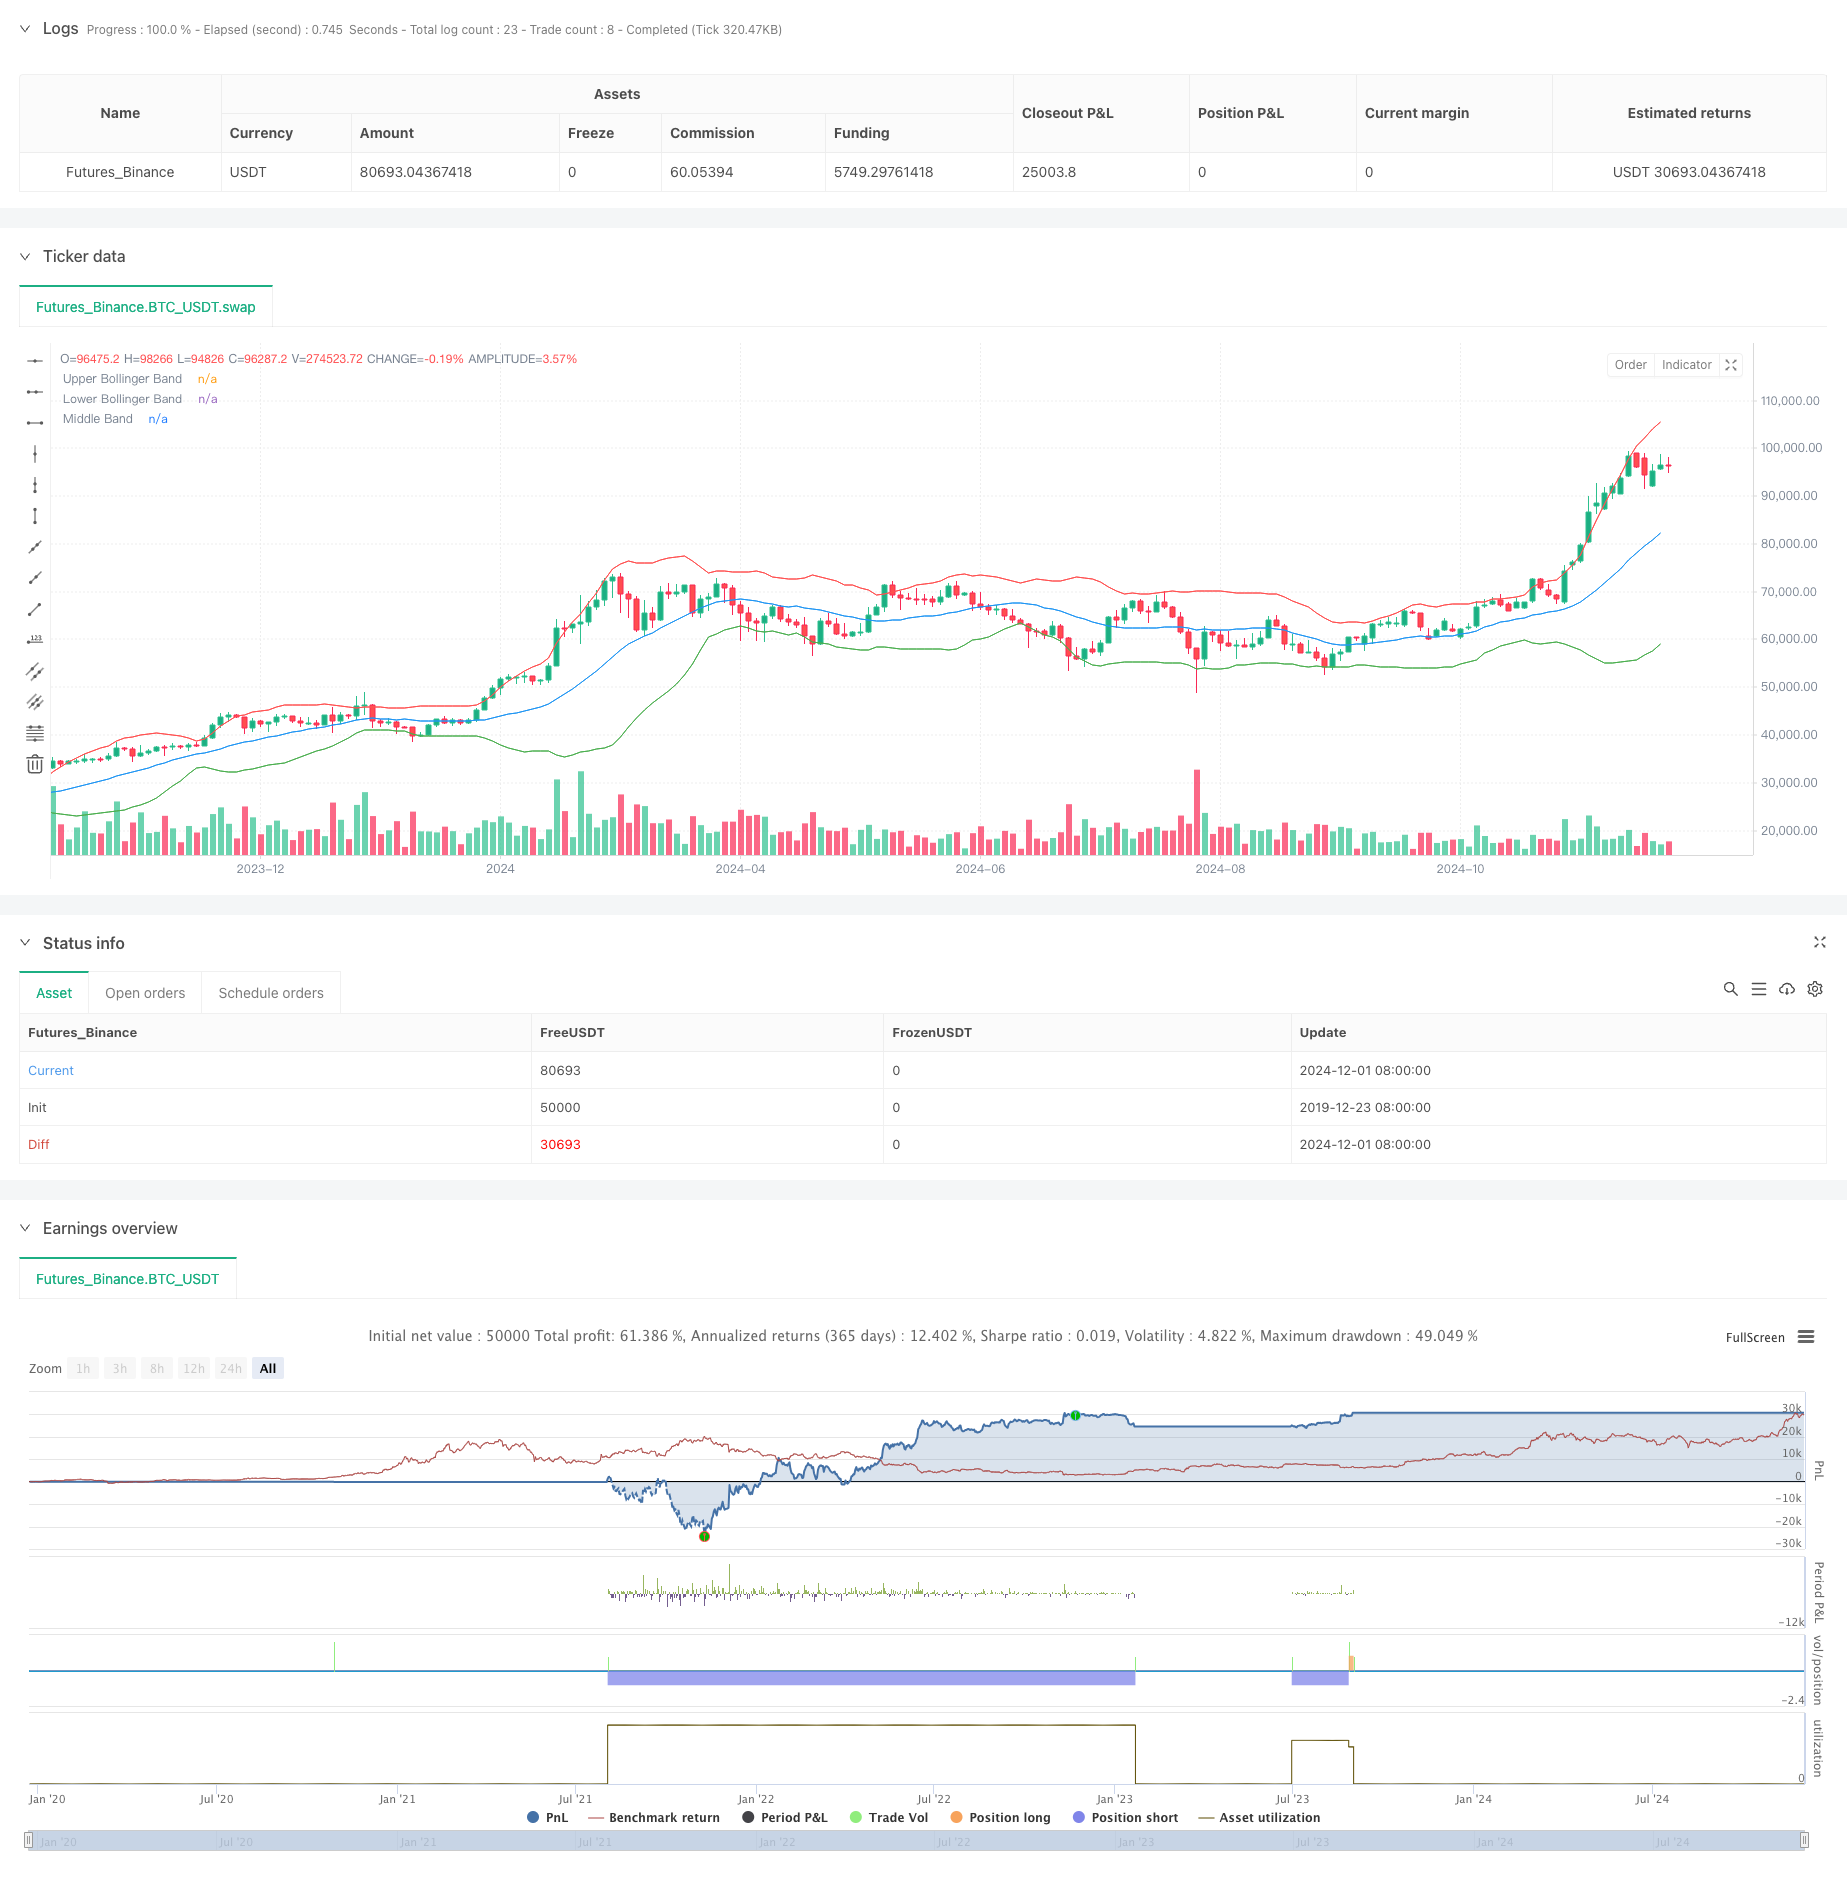
该策略是一个结合布林带指标与价格突破的高频交易系统。策略通过监控价格与布林带的位置关系,结合前期高低点突破信号,在市场出现超买超卖时进行反转交易。系统采用1:1的风险收益比设置止盈止损,并通过可视化的方式展示各个关键价位,帮助交易者直观理解市场走势。
策略原理
策略的核心逻辑建立在两个主要判断条件上:当价格突破前期高点且前期高点位于布林带下轨以下时,触发做多信号;当价格跌破前期低点且前期低点位于布林带上轨以上时,触发做空信号。布林带参数采用20周期移动平均线与2倍标准差,用于判断市场的波动范围和超买超卖区域。系统在触发交易信号后,会自动设置相应的止损位和目标位,并通过不同样式的线条进行可视化展示。
策略优势
- 结合了趋势突破和均值回归两种交易思路,能够在不同市场环境下保持稳定性
- 采用固定的风险收益比进行仓位管理,有利于长期稳定获利
- 通过可视化展示入场、止损和目标位,提高了策略的可操作性
- 布林带指标的使用帮助识别市场超买超卖状态,提高了交易的准确性
- 策略逻辑简单明确,便于理解和执行
策略风险
- 高频交易可能面临较高的交易成本,需要考虑手续费的影响
- 在横盘震荡市场中可能产生频繁的假突破信号
- 固定的风险收益比可能无法充分把握大趋势行情
- 布林带参数固定可能不适应所有市场环境
- 需要实时监控市场以确保信号的及时执行
策略优化方向
- 引入成交量指标作为信号确认,提高突破的可靠性
- 根据市场波动率动态调整布林带参数
- 增加趋势过滤器,避免在横盘市场频繁交易
- 考虑加入时间过滤,避免在不活跃时段交易
- 开发自适应的风险收益比设置机制
总结
这是一个集成了多个技术分析概念的完整交易系统。通过布林带指标与价格突破相结合的方式,策略能够在市场超买超卖区域捕捉反转机会。虽然存在一定的优化空间,但系统的基础框架具有良好的可扩展性和实用价值。通过合理的风险管理和参数优化,该策略有望在实际交易中取得稳定收益。
策略源码
/*backtest
start: 2019-12-23 08:00:00
end: 2024-12-03 00:00:00
period: 2d
basePeriod: 2d
exchanges: [{"eid":"Futures_Binance","currency":"BTC_USDT"}]
*/

//@version=5
strategy("Bollinger Band Scalping", overlay=true)

// Input for Bollinger Bands length and standard deviation
bbLength = input(20, title="Bollinger Bands Length")
stdDev = input(2.0, title="Bollinger Bands Std Dev")

// Calculate and plot the Bollinger Bands
basis = ta.sma(close, bbLength)
deviation = stdDev * ta.stdev(close, bbLength)
upperBB = basis + deviation
lowerBB = basis - deviation

// Get previous candle's values
prevHigh = high[1]   // Previous candle high
prevLow = low[1]     // Previous candle low

// Buy Signal Condition: Current high crossed above previous high and previous high is below the lower Bollinger Band
buyCondition = ta.crossover(high, prevHigh) and (prevHigh < lowerBB[1])

// Sell Signal Condition: Current low crossed below previous low and previous low is above the upper Bollinger Band
sellCondition = ta.crossunder(low, prevLow) and (prevLow > upperBB[1])

// Entry and exit for Buy signals
if (buyCondition)
    strategy.entry("Buy", strategy.long)
    // Calculate target and stop loss
    stopLossPrice = prevLow
    targetPrice = prevHigh + (prevHigh - stopLossPrice)  // 1:1 RR target

    // Set stop loss and target orders
    strategy.exit("Sell", "Buy", limit=targetPrice, stop=stopLossPrice)

    // // Plot entry line
    // line.new(x1=bar_index, y1=prevHigh, x2=bar_index + 12, y2=prevHigh, color=color.green, width=2, style=line.style_solid)
    // // Plot stop loss line
    // line.new(x1=bar_index, y1=stopLossPrice, x2=bar_index + 12, y2=stopLossPrice, color=color.red, width=1, style=line.style_dashed)
    // // Plot target line
    // line.new(x1=bar_index, y1=targetPrice, x2=bar_index + 12, y2=targetPrice, color=color.blue, width=2, style=line.style_solid)

// Entry and exit for Sell signals
if (sellCondition)
    strategy.entry("Sell", strategy.short)
    // Calculate target and stop loss
    stopLossPriceSell = prevHigh
    targetPriceSell = prevLow - (stopLossPriceSell - prevLow)  // 1:1 RR target

    // Set stop loss and target orders
    strategy.exit("Cover", "Sell", limit=targetPriceSell, stop=stopLossPriceSell)

    // // Plot entry line
    // line.new(x1=bar_index, y1=prevLow, x2=bar_index + 12, y2=prevLow, color=color.red, width=2, style=line.style_solid)
    // // Plot stop loss line
    // line.new(x1=bar_index, y1=stopLossPriceSell, x2=bar_index + 12, y2=stopLossPriceSell, color=color.green, width=1, style=line.style_dashed)
    // // Plot target line
    // line.new(x1=bar_index, y1=targetPriceSell, x2=bar_index + 12, y2=targetPriceSell, color=color.blue, width=2, style=line.style_solid)

// Plotting Bollinger Bands with 70% transparency
plot(upperBB, color=color.red, title="Upper Bollinger Band", transp=70)
plot(lowerBB, color=color.green, title="Lower Bollinger Band", transp=70)
plot(basis, color=color.blue, title="Middle Band", transp=70)
相关推荐