资源加载中... loading...

Bollinger Bands Momentum Reversal Quantitative Strategy

Author: ChaoZhang, Date: 2024-09-26 16:21:10
Tags: BBSMASD

img

Overview

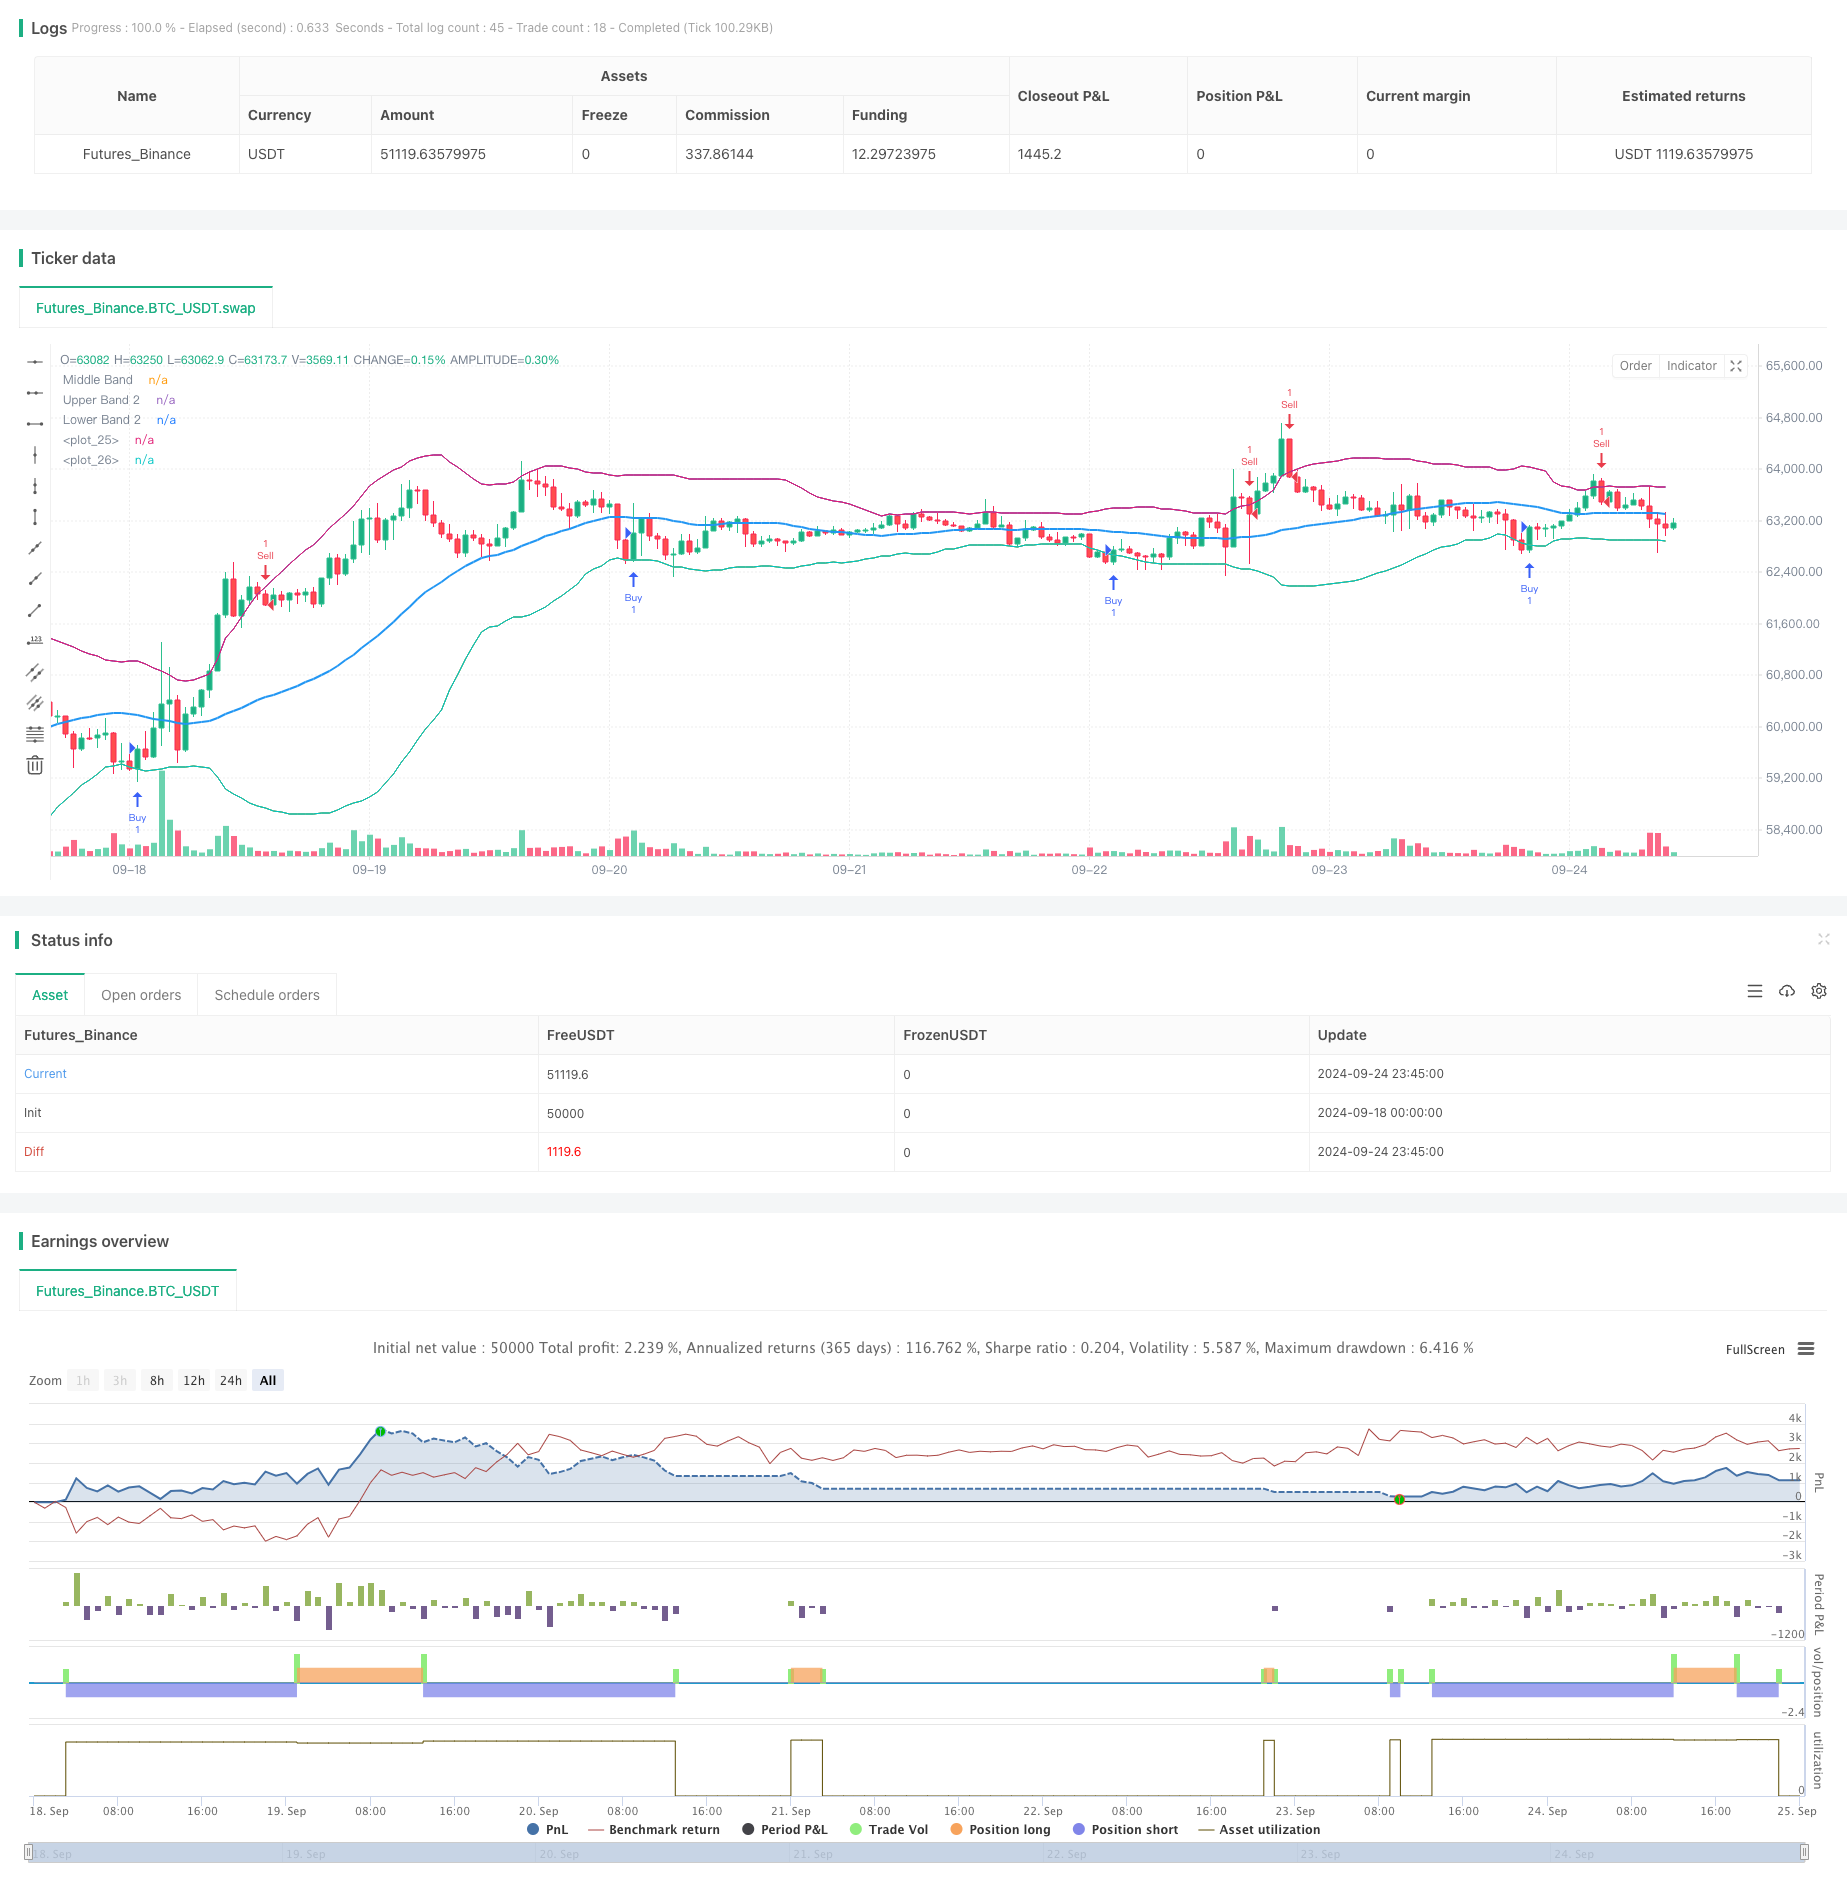
The Bollinger Bands Momentum Reversal Quantitative Strategy is a trading system based on technical analysis that primarily uses the Bollinger Bands indicator to identify overbought and oversold market conditions, aiming to capture potential reversal opportunities. This strategy determines entry points by observing price crossovers with the upper and lower Bollinger Bands, while employing dynamic stop-loss to manage risk. This approach combines trend-following and reversal trading concepts, designed to profit from market volatility.

Strategy Principle

The core principle of this strategy is to use Bollinger Bands to identify extreme market conditions and predict possible reversals. Specifically:

  1. A 34-period Simple Moving Average (SMA) is used as the middle band of the Bollinger Bands.
  2. The upper and lower bands are set at 2 standard deviations above and below the middle band.
  3. When the price crosses below the lower band and then moves back above it, it’s considered an oversold reversal signal, triggering a long position.
  4. When the price crosses above the upper band and then moves back below it, it’s considered an overbought reversal signal, triggering a short position.
  5. For long positions, the stop-loss is set below the lower band; for short positions, it’s set above the upper band.

This design allows the strategy to trade when the market shows extreme movements while limiting potential losses through dynamic stop-loss.

Strategy Advantages

  1. High objectivity: Uses a clear mathematical model (Bollinger Bands) to define market conditions, reducing bias from subjective judgments.
  2. Robust risk management: Employs a dynamic stop-loss mechanism that automatically adjusts risk exposure based on market volatility.
  3. Good adaptability: Bollinger Bands automatically adjust to market volatility, allowing the strategy to maintain relatively stable performance in different market environments.
  4. Reversal capture capability: Focuses on capturing market reversals after overbought/oversold conditions, potentially yielding good returns in oscillating markets.
  5. Simplicity: The strategy logic is intuitive, easy to understand and implement, suitable for traders of different experience levels.

Strategy Risks

  1. False breakout risk: In range-bound markets, prices may frequently touch Bollinger Band boundaries without forming true reversals, leading to frequent trades and potential losses.
  2. Underperformance in trending markets: In strong trends, the strategy may close positions too early or open counter-trend positions, missing out on profits from major trends.
  3. Parameter sensitivity: Strategy performance highly depends on Bollinger Bands parameter settings (period and standard deviation multiplier), which may require different optimizations for different markets.
  4. Slippage and trading costs: Frequent trading may lead to higher transaction costs, impacting overall returns.

Strategy Optimization Directions

  1. Introduce trend filters: Incorporate longer-term trend indicators (e.g., long-period moving averages) to trade only in the direction of the main trend, reducing false signals.
  2. Optimize entry timing: Consider entering positions after the price has regressed a certain percentage inside the Bollinger Bands to improve signal quality.
  3. Dynamic parameter adjustment: Automatically adjust the Bollinger Bands period and standard deviation multiplier based on market volatility to adapt to different market environments.
  4. Add auxiliary indicators: Combine other technical indicators (such as RSI or MACD) to confirm reversal signals and improve trading accuracy.
  5. Implement partial profit-taking: Set trailing stop-losses to lock in partial profits as price moves favorably, addressing potential pullbacks.

Summary

The Bollinger Bands Momentum Reversal Quantitative Strategy is a trading system that combines technical analysis with risk management. By utilizing Bollinger Bands to identify overbought and oversold market conditions, this strategy aims to capture potential price reversal opportunities. Its strengths lie in its objectivity, robust risk management, and adaptability, but it also faces risks such as false breakouts and underperformance in trending markets. Through the introduction of trend filters, optimization of entry timing, and dynamic parameter adjustment, the strategy’s stability and profitability can be further enhanced. Overall, this is a worthy consideration for medium to short-term trading, particularly suitable for traders seeking to profit from market volatility.


/*backtest
start: 2024-09-18 00:00:00
end: 2024-09-25 00:00:00
period: 45m
basePeriod: 45m
exchanges: [{"eid":"Futures_Binance","currency":"BTC_USDT"}]
*/

//@version=5
strategy(shorttitle='MBB_Strategy', title='Bollinger Bands Strategy', overlay=true)

// Inputs
price = input.source(close, title="Source")
period = input.int(34, minval=1, title="Period")  // Renombramos 'length' a 'period'
multiplier = input.float(2.0, minval=0.001, maxval=50, title="Multiplier")  // Renombramos 'mult' a 'multiplier'

// Calculando las bandas de Bollinger
middle_band = ta.sma(price, period)  // Renombramos 'basis' a 'middle_band'
deviation = ta.stdev(price, period)  // Renombramos 'dev' a 'deviation'
deviation2 = multiplier * deviation  // Renombramos 'dev2' a 'deviation2'

upper_band1 = middle_band + deviation  // Renombramos 'upper1' a 'upper_band1'
lower_band1 = middle_band - deviation  // Renombramos 'lower1' a 'lower_band1'
upper_band2 = middle_band + deviation2  // Renombramos 'upper2' a 'upper_band2'
lower_band2 = middle_band - deviation2  // Renombramos 'lower2' a 'lower_band2'

// Plotting Bollinger Bands
plot(middle_band, linewidth=2, color=color.blue, title="Middle Band")
plot(upper_band2, color=color.new(color.blue, 0), title="Upper Band 2")
plot(lower_band2, color=color.new(color.orange, 0), title="Lower Band 2")

// Rellenando áreas entre las bandas
fill(plot(middle_band), plot(upper_band2), color=color.new(color.blue, 80), title="Upper Fill")
fill(plot(middle_band), plot(lower_band2), color=color.new(color.orange, 80), title="Lower Fill")

// Lógica de la estrategia
var bool is_long = false
var bool is_short = false

if (ta.crossover(price, lower_band2))
    strategy.entry("Buy", strategy.long)
    is_long := true
    is_short := false

if (ta.crossunder(price, upper_band2))
    strategy.entry("Sell", strategy.short)
    is_long := false
    is_short := true

// Lógica del stop loss
stop_loss_level_long = lower_band2
stop_loss_level_short = upper_band2

if (is_long)
    strategy.exit("Exit Long", "Buy", stop=stop_loss_level_long)

if (is_short)
    strategy.exit("Exit Short", "Sell", stop=stop_loss_level_short)

template: strategy.tpl:40:21: executing "strategy.tpl" at <.api.GetStrategyListByName>: wrong number of args for GetStrategyListByName: want 7 got 6