
Überblick
Es ist eine hochfrequente, quantifizierte Handelsstrategie, die auf einem Heatchart und einer Analyse von mehrperiodischen Trends basiert. Die Strategie ermöglicht die Erfassung von exakten Markteintrittszeiten durch die Kombination von Widerstandszonen, periodischen und monatlichen Moving Averages, die auf einem Heatchart unterstützt werden, und einem Warnsignalsystem. Im Mittelpunkt der Strategie steht die Identifizierung von Schlüsselpreisregionen durch Heatchart-Technik und die Verwendung von mehrperiodischen Trendbestätigungen zur Erhöhung der Handelsgenauigkeit.
Strategieprinzip
Die Strategie basiert auf folgenden Kernkomponenten:
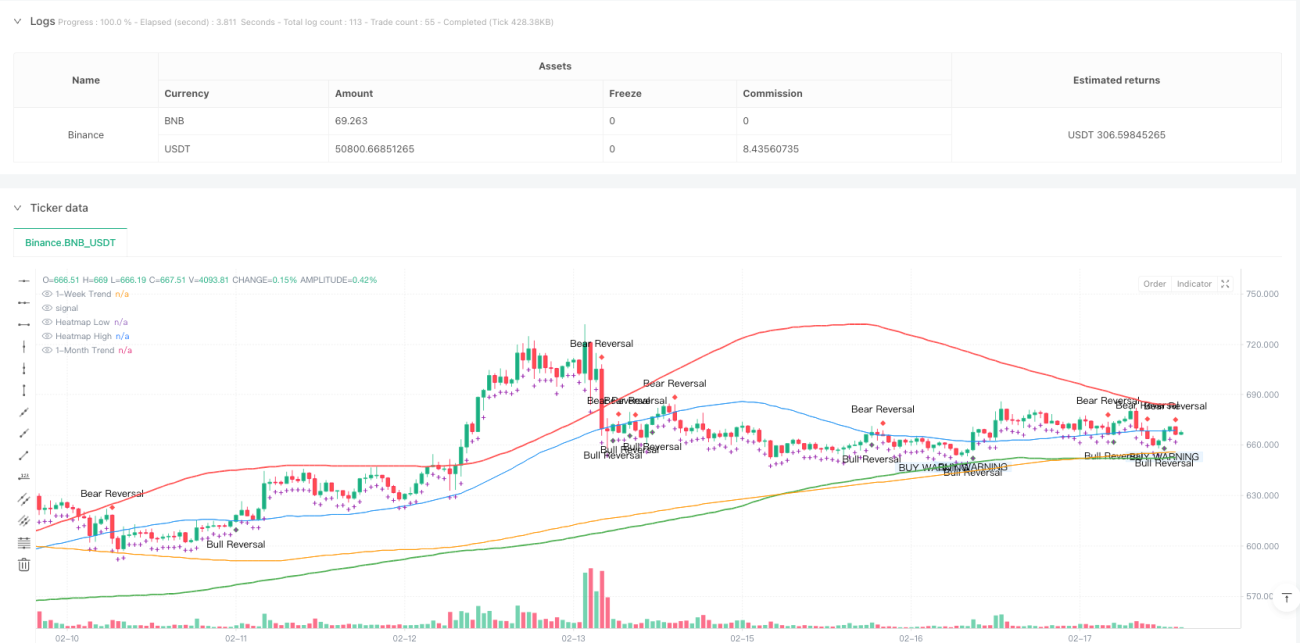
- Heat-Trading-Bereich: Der Widerstandswert wird durch einen Moving Average der Höchst- und Tiefstpreise berechnet, um einen Heat-Trading-Bereich zu bilden.
- Multi-Periodische Trendbestätigung: Um die großen Trends des Marktes zu beurteilen, verwenden Sie den Kreislinie- und den Mondlinie-Moving Average.
- Vorwarnsignale: Vorwarnsignale werden vor dem tatsächlichen Handelssignal gesendet, um den Händlern zu helfen, sich vorzubereiten.
- Trendprognose-Trajectory: zeigt die mögliche Bewegungsrichtung des Preises anhand eines purpurnen Kreuzes.
- Bull-Bear-Reversal-Indikator: zeigt einen potenziellen Trendwendepunkt an, indem er in Form eines Diamanten markiert wird.
Strategische Vorteile
- Multidimensionelle Analyse: kombiniert mit Heatmaps, Trends und Umkehrsignalen bietet umfassende Marktinformationen.
- Vorwarnmechanismen: Vorwarnung durch Vorwarnblasen, um voreilige Entscheidungen zu vermeiden.
- Anpassungsfähigkeit: kann in mehreren Zeiträumen betrieben werden und ist für verschiedene Handelsstile geeignet.
- Visuelle Effekte: Klare visuelle Kennzeichen für schnelle Entscheidungen.
- Risikokontrolle: Verringerung des Risikos von Falschmeldungen durch mehrfache Bestätigungsmechanismen.
Strategisches Risiko
- Risiken von Marktschwankungen: Falsche Signale können während hoher Schwankungen erzeugt werden.
- Parameter-Sensitivität: Die Auswahl der Hitzebild-Sensitivität und der Moving-Average-Periode beeinflusst die Strategie-Performance.
- Das Risiko eines Slippoints: Hochfrequenz-Trading kann mit einem größeren Slippoints konfrontiert sein.
- Transaktionskosten: Häufige Transaktionen können zu höheren Transaktionskosten führen.
- Abhängigkeit vom Marktumfeld: Strategie kann in bestimmten Marktumgebungen nicht wirksam sein.
Richtung der Strategieoptimierung
- Dynamische Parameter-Anpassung: Einführung eines adaptiven Parameter-Systems, das die Heatmap-Sensitivität an Marktschwankungen anpasst.
- Signalfilter: Erhöhung der Transaktionsmenge und der Schwankungsrate der Filter, um falsche Signale zu reduzieren.
- Risikomanagement: Einbeziehung in ein System zur Verwaltung von dynamischen Stop-Loss- und Gewinnzielen.
- Marktumfelderkennung: Entwicklung eines Marktumfelderkennungsmoduls, das automatisch den Handel in einem unpassenden Marktumfeld einstellt.
- Optimierung des Maschinellen Lernens: Einführung von Algorithmen zur Optimierung der Parameterwahl und Signalbestätigung.
Zusammenfassen
Die Hochfrequenz-Quantifizierung Multi-Zyklus-Hotchart-Sniper-Strategie ist ein integriertes Handelssystem, das mehrere technische Kennzahlen kombiniert. Durch die Kombination von Hotchart-Analyse, Multi-Zyklus-Trenderkennung und Warnmechanismen bietet es den Händlern ein zuverlässiges Entscheidungsunterstützungswerkzeug. Der Erfolg der Strategie hängt von der richtigen Parameter-Einstellung und der Wahl des Marktumfelds ab.
- 1