Mehrperioden-Trendfolge- und Divergenzhandelsstrategie für den Donchian-Indikator

Überblick
Die Strategie basiert auf mehrfachen Perioden von Tangxian-Kanal-Indikatoren, um ein Trend-Tracking-System zu erstellen. Durch die Analyse von Tangxian-Kanal-Breakthroughs in verschiedenen Zeiträumen, kombiniert mit dem Haupttrend und der Koordination von lokalen Trends, wird ein visuell intuitiver Trendbänder-Graph erstellt. Die Strategie verwendet Farbtiefschwankungen, um die Stärke und Schwäche des Trends zu zeigen.
Strategieprinzip
Der Kern der Strategie besteht darin, Trends anhand von Donchian-Kanal-Indikatoren zu beurteilen. Der Donchian-Kanal besteht aus einem Höchstpreis- und einem Tiefpreis-Kanal, die Trends werden durch den Vergleich des aktuellen Preises mit der Position des Kanals beurteilt.
- Haupttrendbeurteilung: Nutzung des 20-Perioden-Dongjian-Kanals, bei dem der Preis einen Aufwärtstrend bildet, wenn er die Oberbahn durchbricht, und einen Abwärtstrend bildet, wenn er die Unterbahn durchbricht
- Beurteilung lokaler Trends: Beurteilung der Richtung lokaler Trends unter Verwendung des kürzeren Periodens der Tangxian-Kanal im Rahmen der Haupttrends
- Trendbänder: Kombination von 10 verschiedenen Perioden der Tangxian-Kanäle, die die Trendbänder bilden, wobei die Farben in den Farben die Trendstärke widerspiegeln
- Handelssignale: Haupttrend nach oben, Aufschlag, Haupttrend nach unten, Leerstellung, Trendumkehr, Schlichtung
Strategische Vorteile
- Trends objektiv beurteilen: Beurteilen Sie Trends auf Basis von Preis-Breakouts und vermeiden Sie die Abweichungen, die durch subjektive Beurteilungen entstehen
- Mehrfach-Zyklus-Bestätigung: Verbesserung der Genauigkeit von Trendbeurteilungen durch die Überlagerung von unterschiedlichen Zyklustrends
- Intuitive visuelle Effekte: Farbänderungen der Trendbänder zeigen intuitiv den Marktzustand an
- Regeln für den Handel sind klar: Ein- und Ausstiegssignale sind klar und lassen sich programmatisch umsetzen
- Anpassungsfähigkeit: Strategie-Performance optimiert durch Anpassung der Parameter an die Eigenschaften der Handelsvariante
Strategisches Risiko
- Risiko für eine Trendwende: An einem Trendwendepunkt könnte ein größerer Rückzug eintreten
- Nicht für Schwingungsmärkte: Schwingungsbewegungen können zu falschen Signalen führen.
- Parameter-Sensitivität: Unterschiedliche Parameter-Einstellungen beeinflussen die Effektivität der Strategie
- Schlupfpunkt-Effekte: Häufige Transaktionen können durch Schlupfpunkte beeinflusst werden
- Systemische Risiken: Marktausbrüche können zu erheblichen Verlusten führen
Richtung der Strategieoptimierung
- Erhöhung der Trendstärke-Filter: Einführung von Trendstärke-Indikatoren wie ADX, Filter für schwache Trendsignale
- Optimierte Stop-Loss-Einstellungen: Anpassung der Stop-Loss-Position auf Basis der ATR-Dynamik, um die Risikokontrolle zu verbessern
- Hinzufügen von Transaktionsbestätigung: Kombination von Transaktionsanalysen zur Bestätigung der Effektivität von Trends
- Einführung von Volatilitätsanpassungen: Parameter für die dynamische Anpassung an die Marktfluktuation
- Verbesserung der Positionsverwaltung: Dynamische Anpassung der Positionsgröße auf Basis der Trendstärke
Zusammenfassen
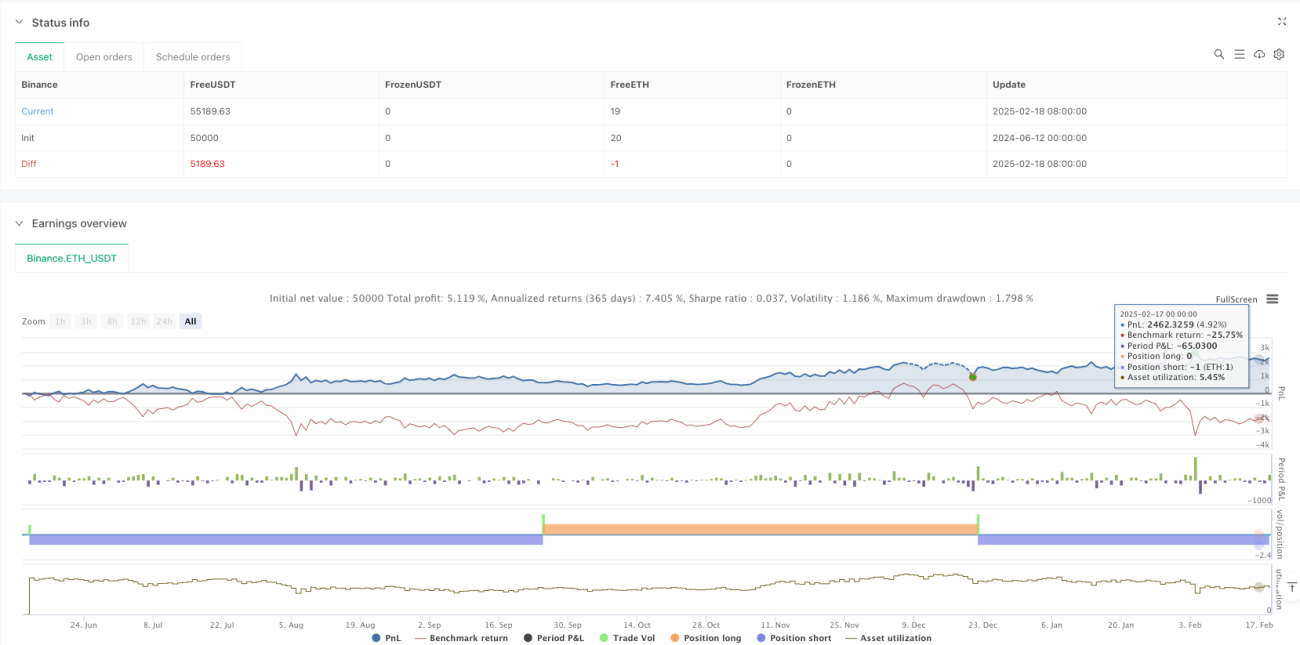
Durch die innovative Anwendung von Multiple Cycle Dongqian Channels wurde ein Trend-Tracking-Trading-System mit hervorragenden visuellen Effekten und logischer Klarheit erstellt. Der Kernvorteil der Strategie besteht darin, den komplexen Trendanalyseprozess zu visualisieren, um es den Händlern zu ermöglichen, die Marktentwicklung intuitiv zu erfassen. Die Strategie hat durch vernünftige Parameteroptimierung und Risikokontrollmaßnahmen einen guten Wert für die Anwendung in der Praxis.
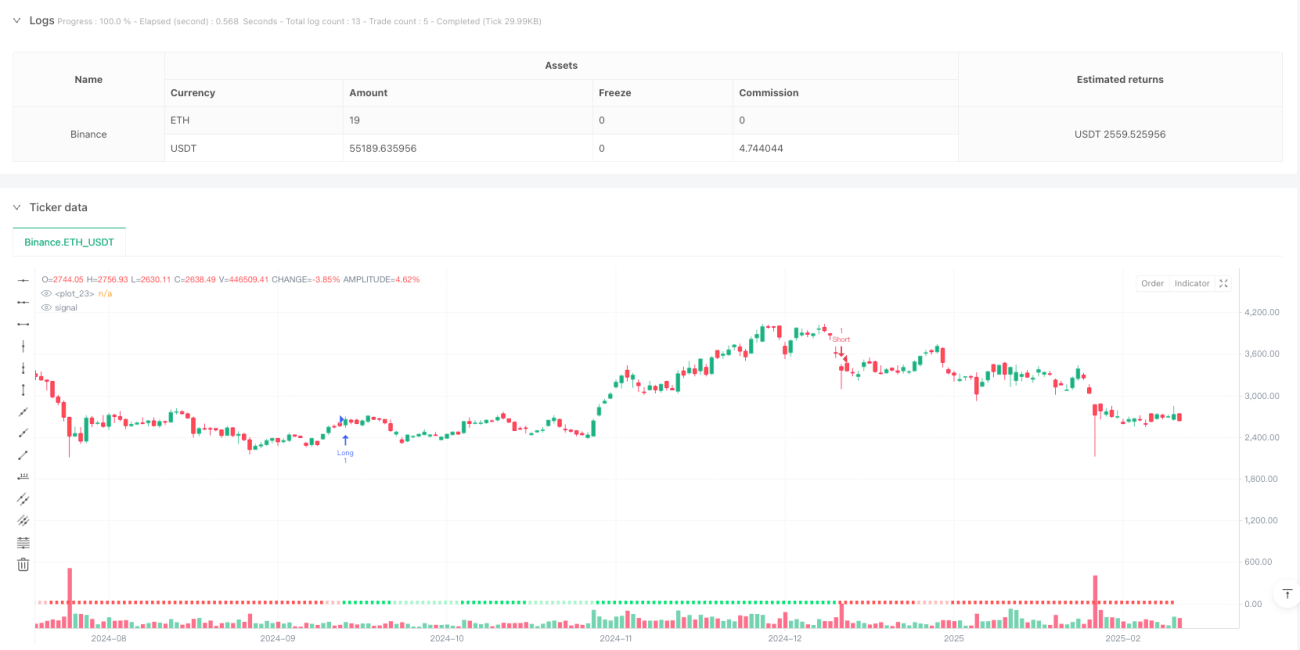
/*backtest
start: 2024-06-12 00:00:00
end: 2025-02-19 08:00:00
period: 1d
basePeriod: 1d
exchanges: [{"eid":"Binance","currency":"ETH_USDT"}]
*/

//@version=6
strategy("Donchian Trend Ribbon Strategy", shorttitle="DonchianTrendRibbonStrat", overlay=true, precision=0)

//~~~~~~~~~~~~~~~~~~~~~~~~~~~~~~~~~~~~~~~~~~~~~~~~~~~~~~~~~~~~~~~~~~~~~~~~~~~~~~- 1