
Überblick
Die Strategie ist ein Trend-Tracking-System, das auf Transaktionsvolumen und Preisänderungen basiert, um die Richtung des Marktes zu prognostizieren, indem es den Netto-Transaktionsvolumen-Schock-Indikator (NVO) berechnet. Die Strategie kombiniert mehrere Moving-Average-Typen (EMA, WMA, SMA, HMA), um den Markttrend zu beurteilen, indem sie den Schok-Indikator mit seiner EMA-Überlagerungslinie vergleicht. Die Strategie enthält auch Stop-Loss- und Stop-Stop-Mechanismen, um Risiken zu kontrollieren und Gewinne zu sichern.
Strategieprinzip
Der Kern der Strategie besteht darin, die Marktstimmung zu beurteilen, indem die Schwankungen des Tagesumsatzes berechnet werden. Die konkreten Berechnungsschritte sind wie folgt:
- Berechnen Sie die Preiskalkulation: Berechnen Sie eine Multiplikation zwischen 0-1 basierend auf dem Höchst-, Mindest- und Schlusskurs des Tages
- Berechnung der effektiven Auf- und Abwärtskurse: Gewichtung der Kurse nach der Richtung der Preisentwicklung und Multiplikation der Kurse
- Berechnung des Nettoumsatzes: Effektiv steigender Umsatz abzüglich effektiver sinkender Umsatz
- App-gewählte Moving Averages: Glatte Verarbeitung der Netto-Transaktionsdaten
- Berechnung der EMA-Überschneidungslinie: Referenzlinie für Trends
- Berechnung der Rate of Change (ROC): Dies wird verwendet, um die Veränderung der Trendstärke zu bestimmen
Die Erzeugung von Handelssignalen basiert auf folgenden Regeln:
- Mehrfache Bedingungen: EMA-Überschneidungen auf Schwingungsindikatoren
- Lüftungsbedingungen: Durchschnitts EMA-Überlagerung unter Schwingungsindikatoren
- Stop Loss: Preisstop auf Basis von Prozent
- Stop: Preisstop auf Basis von Prozent
Strategische Vorteile
- Multidimensionelle Analyse: Marktinformationen in den drei Dimensionen Preis, Umsatz und Trendwechselrate
- Hohe Flexibilität: Unterstützung für verschiedene Arten von Moving Averages, die sich an unterschiedliche Markteigenschaften anpassen lassen
- Gute Risikomanagement: Einschluss von Stop-Loss-Stopp-Mechanismen, um Risiken effektiv zu kontrollieren
- Sehr visuelle Effekte: Trendstärken können in einer Querkarte dargestellt werden, um die Marktlage zu verstehen
- Anpassungsfähigkeit: Durch die parametrische Gestaltung kann man sich an verschiedene Marktumgebungen und Handelsarten anpassen
Strategisches Risiko
- Risiko einer Trendwende: Häufige Falschsignale in schwankenden Märkten
- Verzögerungsrisiko: Der Moving Average selbst hat eine gewisse Verzögerung, die zu unvorhergesehenen Einstiegs- und Ausstiegsmomenten führen kann
- Parametersensitivität: Unterschiedliche Parameterkombinationen können zu großen Unterschieden in der Strategieleistung führen
- Abhängigkeit vom Marktumfeld: In bestimmten Marktumgebungen kann es schlechter laufen
- Technische Einschränkungen: Verlassen auf technische Indikatoren ohne Berücksichtigung grundlegender Faktoren
Vorschläge zur Risikokontrolle:
- Empfehlung zur Optimierung von Parametern für unterschiedliche Marktumstände
- Signalbestätigung in Kombination mit anderen technischen Kennzahlen
- Anpassung der Stop-Loss-Stopp-Parameter an die unterschiedlichen Marktschwankungen
Richtung der Strategieoptimierung
-
Optimierung der Signalbestätigung:
- Erhöhung der Bestätigungsvoraussetzungen
- Trendstärkefilter hinzufügen
- Einführung eines Mechanismus zur Anpassung der Volatilität
-
Optimierung des Risikomanagements:
- Implementierung eines dynamischen Stop-Loss-Mechanismus
- Hinzufügen eines Moduls zur Geldverwaltung
- Einführung von Schlachtungs- und Entlastungsmechanismen
-
Parameter optimiert:
- Entwicklung von Anpassungsparameter-Anpassungsmechanismen
- Um Parameterwechsel basierend auf Marktbedingungen zu realisieren
- Hinzufügen von Machine-Learning-Modellen zur Parameteroptimierung
Zusammenfassen
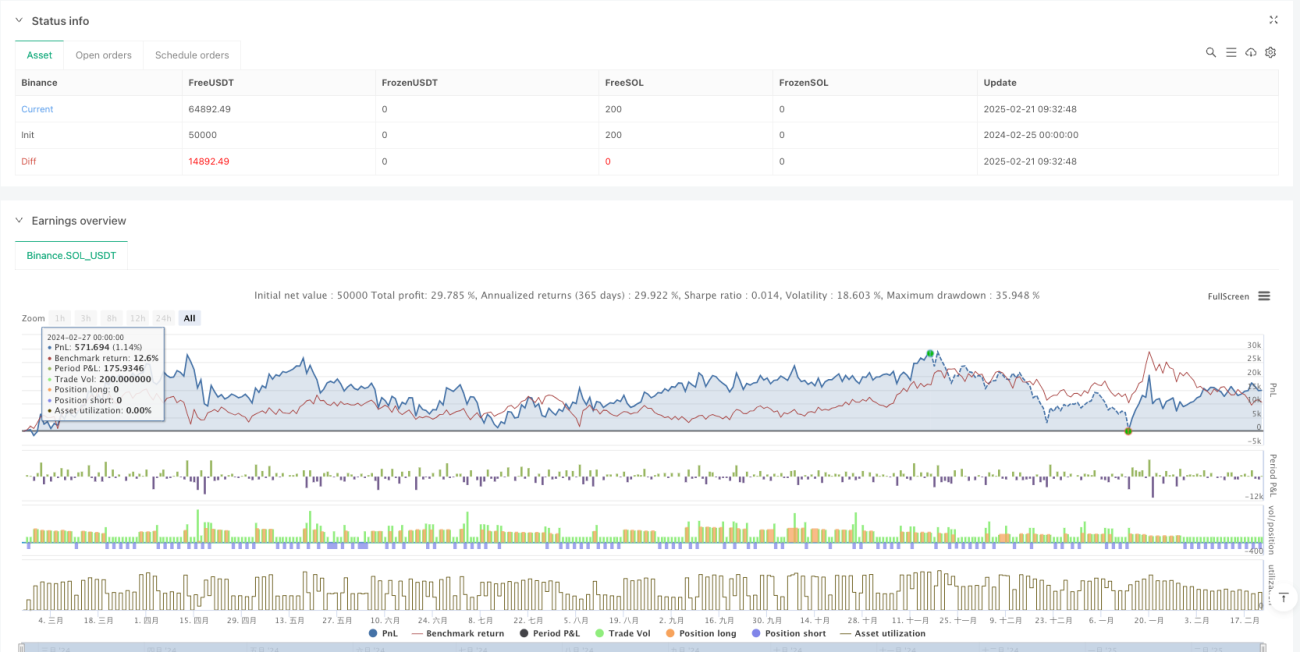
Die Strategie besteht aus einer umfassenden Analyse von Transaktionsvolumen und Preisdaten, um ein relativ vollständiges Trend-Tracking-Handelssystem zu erstellen. Die Hauptmerkmale der Strategie sind die Kombination mehrerer technischer Indikatoren und die Bereitstellung flexibler Parameterkonfigurationsoptionen. Obwohl ein gewisses Risiko besteht, ist die Strategie durch angemessene Risikokontrolle und kontinuierliche Optimierung berechtigt, stabile Erträge im tatsächlichen Handel zu erzielen.
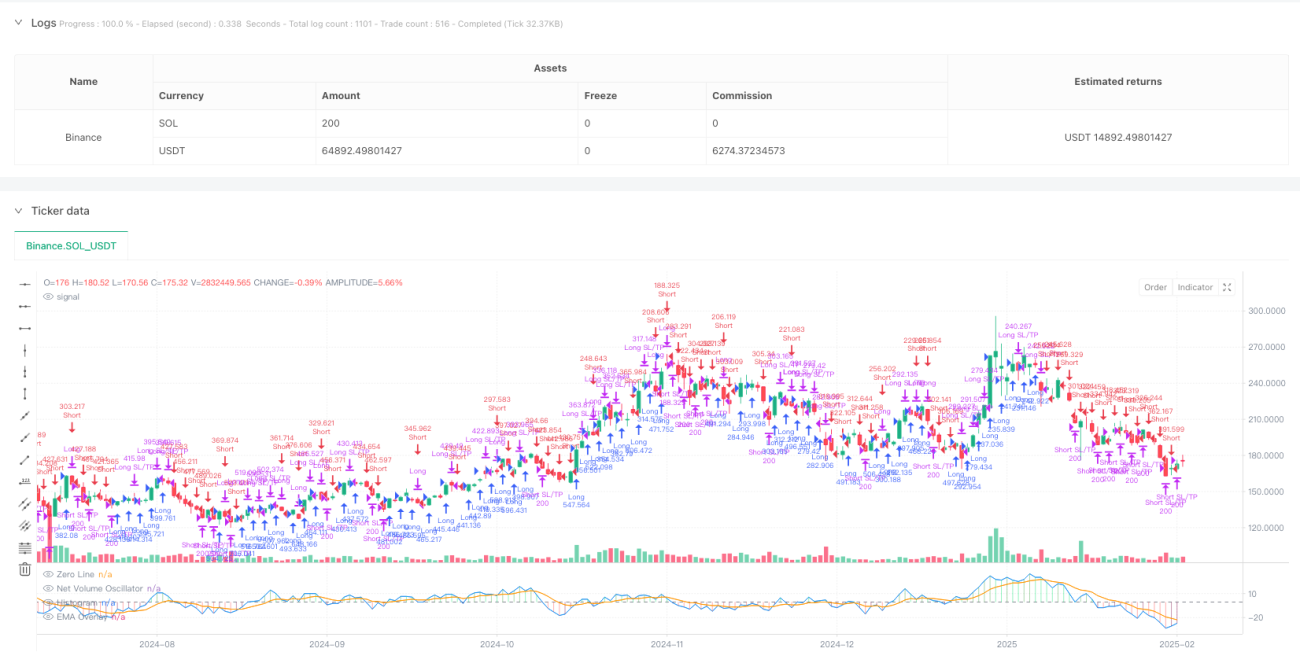
/*backtest
start: 2024-02-25 00:00:00
end: 2025-02-22 08:00:00
period: 1d
basePeriod: 1d
exchanges: [{"eid":"Binance","currency":"SOL_USDT"}]
*/

//@version=5
strategy("EMA-Based Net Volume Oscillator with Trend Change", shorttitle="NVO Trend Change", overlay=false, initial_capital=100000, default_qty_type=strategy.percent_of_equity, default_qty_value=100)

// Input parameters- 1