Doppelt exponentielle gleitende Durchschnitts-Bounce-Momentum-Handelsstrategie

EMA SL TP R:R 趋势一致性 反弹交易 动量交易 风险管理 蜡烛图形态
Erstellungsdatum: 2025-06-03 10:59:06 zuletzt geändert: 2025-06-03 10:59:06
Kopie: 0 Klicks: 281
2
konzentrieren Sie sich auf
319
Anhänger

Doppelt exponentielle gleitende Durchschnitts-Bounce-Momentum-Handelsstrategie Doppelt exponentielle gleitende Durchschnitts-Bounce-Momentum-Handelsstrategie

Überblick

Diese Strategie nutzt die bi-indizes bewegliche Durchschnittslinie (EMA) der gebildeten Preise, um eine hohe Wahrscheinlichkeit für eine Umkehrung zu erkennen. Es ist keine einfache Durchschnittslinie-Strategie, sondern eine Zeit, in der der Preis von der EMA-Band zurückprallt und eine starke Dynamik bildet. Die Strategie verwendet 12-Zyklus- und 21-Zyklus-EMA, um Handelsbereiche zu erstellen, und kombiniert Pivot-Grafiken, Trendkonsistenz und ein präzises Risikomanagementsystem, um Marktdynamik zu erfassen.

Strategieprinzip

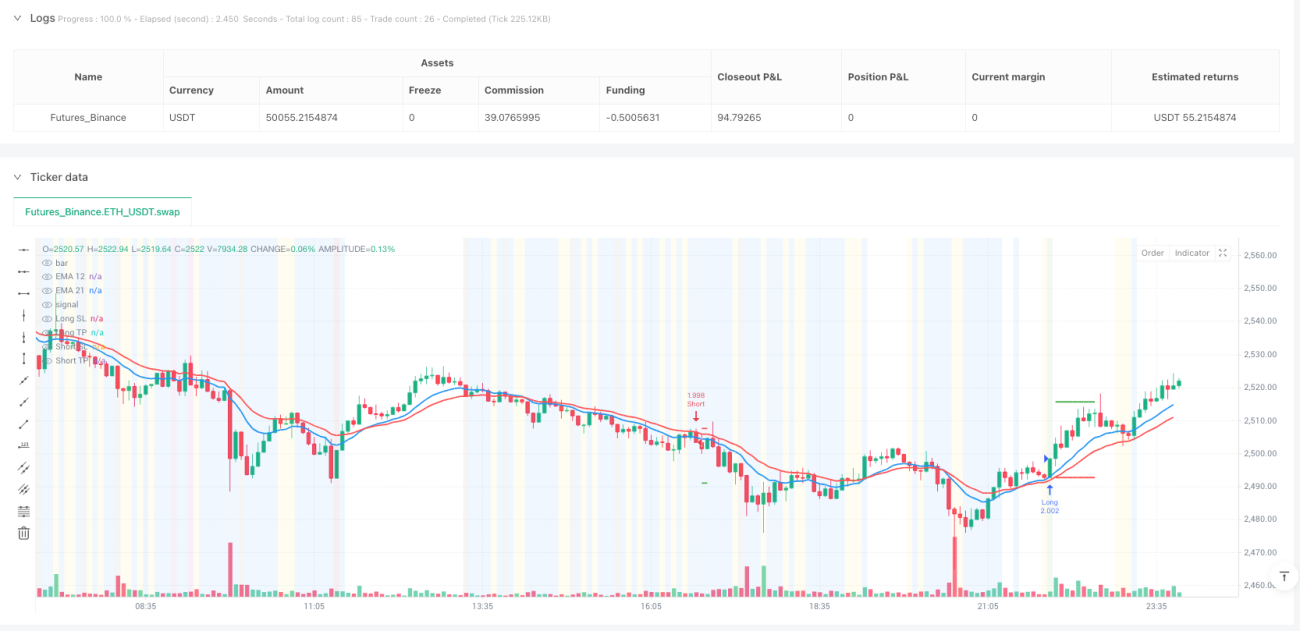
Das Kernprinzip der Strategie besteht darin, nach Einstiegssignalen zu suchen, indem man die Situation erkennt, in der der Preis von einer EMA zurückschlägt. Es verwendet 12-Zyklus- und 21-Zyklus-EMA, um eine obere und untere Handelszone zu erstellen und die Richtung der Markttrend basierend auf der relativen Position der EMA zu bestimmen.

Wenn die EMA12 > die EMA21 in einem rückläufigen Umfeld ist (grüne Zone), suchen wir nach Möglichkeiten, mehr zu tun. Die Bedingungen sind: Die untere Schattenlinie berührt die EMA-Band und bildet eine starke Bollung (ein Unternehmen, das größer ist als die untere Schattenlinie), die obere Schattenlinie wird minimiert (weniger als 2% der Bollung), der Abschlusspreis ist höher als die beiden EMAs, die vorherige Bollung ist nicht unter der unteren Zone, und mehrere Wurzeln in Folge halten die Bollungstendenz konsistent.

Wenn die EMA12 < EMA21 ist, ist der Markt in einem rückläufigen Umfeld (Rotband), und wir suchen nach Verlustsituationen. Die Bedingungen für den Verlust umfassen: die Oberschattenlinie berührt die EMA-Band und bildet einen starken Rückschlag (Einheit größer als die Oberschattenlinie), die Unterschattenlinie minimiert sich (weniger als 2% der Kurvenbreite), der Abschlusspreis liegt unter den beiden EMAs, die vorherige Kurve ist nicht über der Oberschleife, und mehrere Stämme in Folge halten die Abwärtstrendkonsistenz.

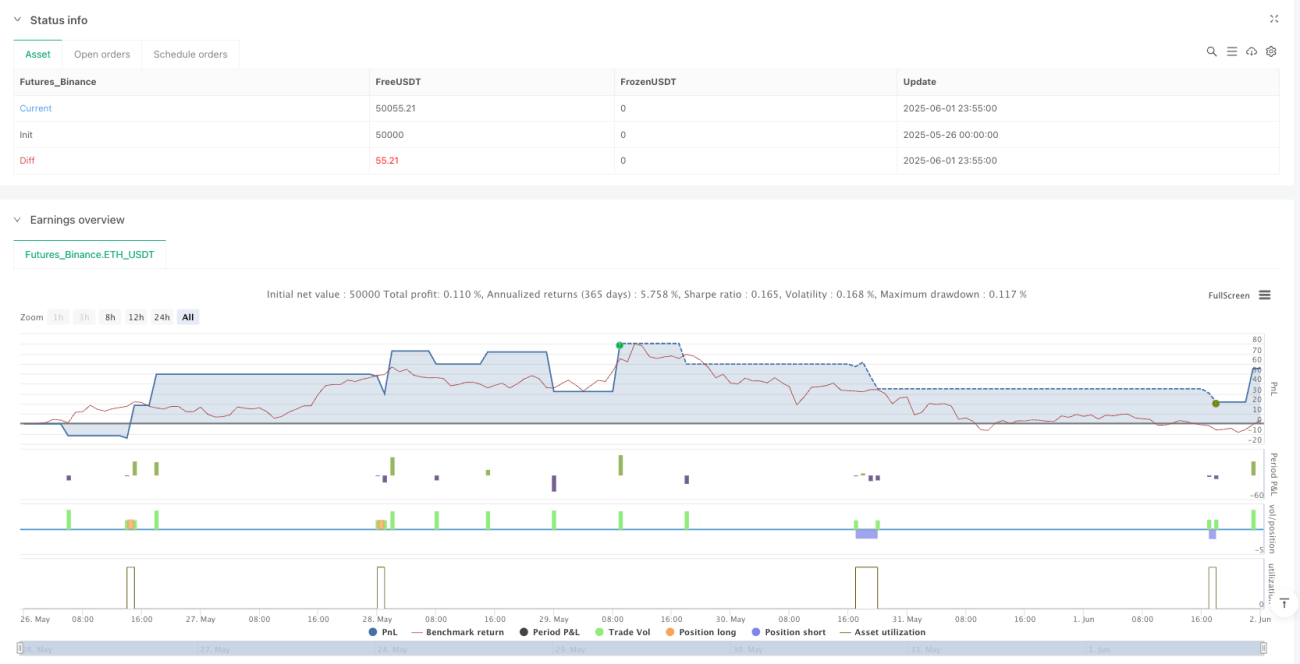
Die Strategie enthält ein Risikomanagementsystem mit einem festen Risiko-Rendite-Verhältnis, das die Default-Wertung 3:1 enthält. Der Stop-Loss wird auf den Höchst-/Tiefpunkt der vorherigen Stufe gesetzt, und der Stop-Loss wird automatisch nach dem Risiko-Rendite-Verhältnis berechnet.

Strategische Vorteile

Diese Strategie hat mehrere bedeutende Vorteile:

  1. High Win Potential: Durch die Erfassung der starken Dynamik nach dem Aufprall der EMA-Band identifiziert die Strategie Handelschancen mit einer hohen Erfolgswahrscheinlichkeit.

  2. Klare Ein- und Ausstiegsregeln: Die Strategie bietet klare Handelsbedingungen und reduziert den Einfluss subjektiver Urteile und emotionaler Entscheidungen.

  3. Gutes Risikomanagement: Ein fester Risiko-Rendite-Verhältnis und eine automatische Stop-Loss-Einstellung sorgen dafür, dass das Risiko für jeden Handel unter Kontrolle ist.

  4. Trend folgt dem Vorteil: Die Strategie besteht darin, nur in der Richtung zu handeln, in der der Trend vorherrscht, um das hohe Risiko eines Gegenangebots zu vermeiden.

  5. Die Strategie funktioniert effektiv über verschiedene Zeiträume und bietet flexible Handelsoptionen.

  6. Umfassende Erinnerungssysteme: Eingebettete Erinnerungssysteme mit detaillierten Handelssignalen, um sicherzustellen, dass Sie keine Handelsgelegenheiten verpassen.

  7. Visuelle Unterstützung: Intuitive Anzeige von Handelssignalen und Konditionsstatus durch Hintergrundfarbänderungen und Etikettenausschläge.

Strategisches Risiko

Obwohl die Strategie so gut konzipiert ist, gibt es folgende potenzielle Risiken:

  1. Schwankungsrisiko: In schwankenden Märkten können die EMA-Bänder dicht werden, wodurch ein häufiges, aber minderwertiges Signal erzeugt wird, was zu einem kontinuierlichen Stop-Loss führt.

  2. Gefahr eines heftigen Kurssprungs: Der Markt kann nach wichtigen Nachrichten oder Ereignissen springen, was den Stop-Loss-Punkt außer Kraft setzt und zu übererwarteten Verlusten führt.

  3. Überoptimierung der Parameter: Überoptimierung der Parameter einer Strategie kann zu Kurvenanpassung führen, wodurch die Strategie im Live-Trading schlechter abschneidet.

  4. Verzögerung bei der Trenderkennung: Die EMA als Rückstandsindikator kann an Trendwendepunkten langsam reagieren, was zu einem verpassten optimalen Einstiegspunkt oder einem verzögerten Ausstieg führt.

  5. Stop-Loss-Triggerrisiko: Marktlärm kann dazu führen, dass der Stop-Loss ausgelöst wird und der Preis in die erwartete Richtung zurückkehrt, was zu unnötigen Verlusten führt.

Lösungen umfassen: Aussetzung des Handels in einem bewegten Markt; Vermeidung von minderwertigen Signalen durch die Verwendung von Fluktuationsfiltern; Bestätigung von Trends in Kombination mit anderen Indikatoren; Regelmäßige Rückmessung und Optimierung von Parametern; Berücksichtigung der Verwendung von Tracking-Stopps.

Richtung der Strategieoptimierung

Die Strategie kann in den folgenden Bereichen optimiert werden:

  1. Dynamisches Risikomanagement: Die Rentabilität und die Größe der Positionen werden automatisch an die Marktschwankungen angepasst, um die Risikothek bei hoher Volatilität zu verringern.

  2. Hochwertige Filter eingeführt: In Kombination mit dem ATR (Average True Rate) wird das Signal für die niedrigen Schwankungen gefiltert; die Bestätigung der Transaktionsmenge wird hinzugefügt, um die Wirksamkeit des Preisrückgangs zu überprüfen.

  3. Multi-Zeit-Perioden-Analyse: Integration der Trendrichtung in höheren Zeitperioden als zusätzliche Filterbedingungen, nur dann zugelassen, wenn die Trends in mehreren Zeitperioden übereinstimmen

  4. Optimierung durch maschinelles Lernen: Dynamische Anpassung der Parameter durch Maschinelles Lernen, um die optimale Parameterkombination an unterschiedliche Marktbedingungen anzupassen.

  5. Verfolgung von Stop-Loss-Realisation: Ein Stop-Loss-Verfolgungsmechanismus wird eingesetzt, um einen Teil des Gewinns zu sperren, während der Trend fortgesetzt werden kann, nachdem der Gewinn ein bestimmtes Niveau erreicht hat.

  6. Teilweise Gewinnstrategie: Implementierung von Teilweise Gewinnstrategie, schrittweise Verringerung der Position bei verschiedenen Zielpreisen, Optimierung der Gesamtrisiko-Rendite.

Diese Optimierungsrichtungen können die Robustheit, Anpassungsfähigkeit und langfristige Rentabilität der Strategie verbessern.

Zusammenfassen

Die Binary Moving Average Band Rebound Dynamics Trading Strategy ist ein integriertes Handelssystem, das technische Analyse, Graphikerkennung und strenge Risikomanagement kombiniert. Es fängt Marktchancen mit explosiver Dynamik ein, indem es hohe Wahrscheinlichkeiten für einen Preisrückschlag von der EMA-Band erkennt. Die Kernvorteile der Strategie liegen in ihren klaren Handelsregeln, festgelegten Risikobereitschaftsrahmen und Trendkonformitätsanforderungen, die sie für verschiedene Marktumgebungen und Zeitabschnitte geeignet machen.

Trotz einiger potenzieller Risiken können Händler die Stabilität und Profitabilität ihrer Strategien durch die Implementierung von Optimierungsmaßnahmen weiter verbessern. Die Strategie ist besonders für Händler geeignet, die eine systematische, disziplinierte und risikokontrollierte Handelsmethode suchen.

Strategiequellcode
/*backtest
start: 2025-05-26 00:00:00
end: 2025-06-02 00:00:00
period: 5m
basePeriod: 5m
exchanges: [{"eid":"Futures_Binance","currency":"ETH_USDT"}]
*/

//@version=5
strategy("Enhanced EMA Band Rejection Strategy", overlay=true, initial_capital=10000, default_qty_type=strategy.percent_of_equity, default_qty_value=10)

// Input parameters
ema12_length = input.int(12, title="EMA 12 Length")
ema21_length = input.int(21, title="EMA 21 Length")
max_wick_percent = input.float(2.0, title="Max Wick % at High/Low", minval=0.0, maxval=10.0)
risk_reward_ratio = input.float(3.0, title="Risk/Reward Ratio (R)", minval=1.0, maxval=10.0)
trend_consistency_bars = input.int(5, title="Trend Consistency Required (Bars)", minval=1, maxval=20)

// Notification Settings
enable_notifications = input.bool(true, title="Enable Notifications", group="Notifications")
notify_on_entry = input.bool(true, title="Notify on Trade Entry", group="Notifications")
notify_on_exit = input.bool(true, title="Notify on Trade Exit", group="Notifications")
notify_on_setup = input.bool(false, title="Notify on Potential Setup (Pre-Entry)", group="Notifications")
notify_on_failed_conditions = input.bool(false, title="Notify on Failed Conditions", group="Notifications")

// Calculate EMAs
ema12 = ta.ema(close, ema12_length)
ema21 = ta.ema(close, ema21_length)

// Determine upper and lower EMA bands
ema_upper = math.max(ema12, ema21)
ema_lower = math.min(ema12, ema21)

// Plot EMAs
plot(ema12, color=color.blue, linewidth=2, title="EMA 12")
plot(ema21, color=color.red, linewidth=2, title="EMA 21")

// Calculate candle components
body_size = math.abs(close - open)
upper_wick = high - math.max(open, close)
lower_wick = math.min(open, close) - low
candle_range = high - low

// Calculate wick percentages
upper_wick_percent = candle_range > 0 ? (upper_wick / candle_range) * 100 : 0
lower_wick_percent = candle_range > 0 ? (lower_wick / candle_range) * 100 : 0

// Determine EMA trend direction
ema_bullish = ema12 > ema21  // Green bands - bullish trend
ema_bearish = ema12 < ema21  // Red bands - bearish trend

// Check trend consistency for required number of bars
bullish_consistency_check = true
bearish_consistency_check = true

for i = 0 to trend_consistency_bars - 1
    ema12_past = ta.ema(close[i], ema12_length)
    ema21_past = ta.ema(close[i], ema21_length)
    if ema12_past <= ema21_past
        bullish_consistency_check := false
    if ema12_past >= ema21_past
        bearish_consistency_check := false

// Final trend conditions with consistency requirement
ema_bullish_consistent = ema_bullish and bullish_consistency_check
ema_bearish_consistent = ema_bearish and bearish_consistency_check

// NEW RULE: Previous candle close position relative to bands
prev_close_above_upper_band = close[1] > ema_upper[1]
prev_close_below_lower_band = close[1] < ema_lower[1]
prev_close_within_bands = close[1] >= ema_lower[1] and close[1] <= ema_upper[1]

// Long setup conditions (only when EMAs are bullish/green consistently)
long_wick_condition = low <= ema_lower or (low <= ema_upper and low >= ema_lower)
long_body_condition = body_size >= lower_wick
long_wick_percent_condition = upper_wick_percent <= max_wick_percent
long_bullish_candle = close > open
long_trend_condition = ema_bullish_consistent  // Only long when bands are consistently green
long_close_above_bands = close > ema_upper  // NEW: Close must be above both EMAs
// Previous candle must not have closed below the lower band
long_prev_close_condition = not prev_close_below_lower_band
long_setup = long_wick_condition and long_body_condition and long_wick_percent_condition and long_bullish_candle and long_trend_condition and long_close_above_bands and long_prev_close_condition

// Short setup conditions (only when EMAs are bearish/red consistently)
short_wick_condition = high >= ema_upper or (high >= ema_lower and high <= ema_upper)
short_body_condition = body_size >= upper_wick
short_wick_percent_condition = lower_wick_percent <= max_wick_percent
short_bearish_candle = close < open
short_trend_condition = ema_bearish_consistent  // Only short when bands are consistently red
short_close_below_bands = close < ema_lower  // NEW: Close must be below both EMAs
// Previous candle must not have closed above the upper band
short_prev_close_condition = not prev_close_above_upper_band
short_setup = short_wick_condition and short_body_condition and short_wick_percent_condition and short_bearish_candle and short_trend_condition and short_close_below_bands and short_prev_close_condition

// Entry conditions
var float long_sl = na
var float short_sl = na
var float long_tp = na
var float short_tp = na

if long_setup and strategy.position_size == 0
    strategy.entry("Long", strategy.long)
    long_sl := low
    risk_amount = close - long_sl
    long_tp := close + (risk_amount * risk_reward_ratio)
    label.new(bar_index, low, "LONG", style=label.style_label_up, color=color.green, size=size.small)
    
    // Entry Notification
    if enable_notifications and notify_on_entry
        alert("🟢 LONG ENTRY SIGNAL\n" + 
              "Symbol: " + syminfo.ticker + "\n" + 
              "Price: " + str.tostring(close, "#.####") + "\n" + 
              "Stop Loss: " + str.tostring(long_sl, "#.####") + "\n" + 
              "Take Profit: " + str.tostring(long_tp, "#.####") + "\n" + 
              "Risk/Reward: " + str.tostring(risk_reward_ratio, "#.##") + "R\n" + 
              "Time: " + str.tostring(time), alert.freq_once_per_bar)

if short_setup and strategy.position_size == 0
    strategy.entry("Short", strategy.short)
    short_sl := high
    risk_amount = short_sl - close
    short_tp := close - (risk_amount * risk_reward_ratio)
    label.new(bar_index, high, "SHORT", style=label.style_label_down, color=color.red, size=size.small)
    
    // Entry Notification
    if enable_notifications and notify_on_entry
        alert("🔴 SHORT ENTRY SIGNAL\n" + 
              "Symbol: " + syminfo.ticker + "\n" + 
              "Price: " + str.tostring(close, "#.####") + "\n" + 
              "Stop Loss: " + str.tostring(short_sl, "#.####") + "\n" + 
              "Take Profit: " + str.tostring(short_tp, "#.####") + "\n" + 
              "Risk/Reward: " + str.tostring(risk_reward_ratio, "#.##") + "R\n" + 
              "Time: " + str.tostring(time), alert.freq_once_per_bar)

// Exit conditions with fixed R:R
if strategy.position_size > 0
    // Long position - fixed stop loss and take profit
    strategy.exit("Long Exit", "Long", stop=long_sl, limit=long_tp)
    
    // Exit Notifications
    if enable_notifications and notify_on_exit
        if close <= long_sl
            alert("🛑 LONG STOP LOSS HIT\n" + 
                  "Symbol: " + syminfo.ticker + "\n" + 
                  "Exit Price: " + str.tostring(close, "#.####") + "\n" + 
                  "Loss: " + str.tostring(close - strategy.position_avg_price, "#.####") + "\n" + 
                  "Time: " + str.tostring(time), alert.freq_once_per_bar)
        if close >= long_tp
            alert("🎯 LONG TAKE PROFIT HIT\n" + 
                  "Symbol: " + syminfo.ticker + "\n" + 
                  "Exit Price: " + str.tostring(close, "#.####") + "\n" + 
                  "Profit: " + str.tostring(close - strategy.position_avg_price, "#.####") + "\n" + 
                  "Time: " + str.tostring(time), alert.freq_once_per_bar)

if strategy.position_size < 0
    // Short position - fixed stop loss and take profit
    strategy.exit("Short Exit", "Short", stop=short_sl, limit=short_tp)
    
    // Exit Notifications
    if enable_notifications and notify_on_exit
        if close >= short_sl
            alert("🛑 SHORT STOP LOSS HIT\n" + 
                  "Symbol: " + syminfo.ticker + "\n" + 
                  "Exit Price: " + str.tostring(close, "#.####") + "\n" + 
                  "Loss: " + str.tostring(strategy.position_avg_price - close, "#.####") + "\n" + 
                  "Time: " + str.tostring(time), alert.freq_once_per_bar)
        if close <= short_tp
            alert("🎯 SHORT TAKE PROFIT HIT\n" + 
                  "Symbol: " + syminfo.ticker + "\n" + 
                  "Exit Price: " + str.tostring(close, "#.####") + "\n" + 
                  "Profit: " + str.tostring(strategy.position_avg_price - close, "#.####") + "\n" + 
                  "Time: " + str.tostring(time), alert.freq_once_per_bar)

// Plot stop levels and take profit levels
plot(strategy.position_size > 0 ? long_sl : na, color=color.red, linewidth=2, style=plot.style_line, title="Long SL")
plot(strategy.position_size < 0 ? short_sl : na, color=color.red, linewidth=2, style=plot.style_line, title="Short SL")
plot(strategy.position_size > 0 ? long_tp : na, color=color.green, linewidth=2, style=plot.style_line, title="Long TP")
plot(strategy.position_size < 0 ? short_tp : na, color=color.green, linewidth=2, style=plot.style_line, title="Short TP")

// Additional Notification Logic
// Potential Setup Notifications (when most conditions are met but not all)
long_potential_setup = long_wick_condition and long_body_condition and long_wick_percent_condition and long_bullish_candle and long_trend_condition and long_prev_close_condition and not long_close_above_bands
short_potential_setup = short_wick_condition and short_body_condition and short_wick_percent_condition and short_bearish_candle and short_trend_condition and short_prev_close_condition and not short_close_below_bands

if enable_notifications and notify_on_setup and strategy.position_size == 0
    if long_potential_setup
        alert("⚠️ POTENTIAL LONG SETUP\n" + 
              "Symbol: " + syminfo.ticker + "\n" + 
              "Price: " + str.tostring(close, "#.####") + "\n" + 
              "Status: Close needs to be above " + str.tostring(ema_upper, "#.####") + "\n" + 
              "Current Close: " + str.tostring(close, "#.####") + "\n" + 
              "Time: " + str.tostring(time), alert.freq_once_per_bar)
    
    if short_potential_setup
        alert("⚠️ POTENTIAL SHORT SETUP\n" + 
              "Symbol: " + syminfo.ticker + "\n" + 
              "Price: " + str.tostring(close, "#.####") + "\n" + 
              "Status: Close needs to be below " + str.tostring(ema_lower, "#.####") + "\n" + 
              "Current Close: " + str.tostring(close, "#.####") + "\n" + 
              "Time: " + str.tostring(time), alert.freq_once_per_bar)

// Failed Conditions Notifications (for debugging)
if enable_notifications and notify_on_failed_conditions and strategy.position_size == 0
    if long_wick_condition and long_body_condition and long_wick_percent_condition and long_bullish_candle and not long_trend_condition
        alert("❌ LONG SETUP FAILED\n" + 
              "Symbol: " + syminfo.ticker + "\n" + 
              "Reason: " + (not ema_bullish ? "EMA trend bearish" : "EMA trend not consistent") + "\n" + 
              "EMA12: " + str.tostring(ema12, "#.####") + "\n" + 
              "EMA21: " + str.tostring(ema21, "#.####") + "\n" + 
              "Time: " + str.tostring(time), alert.freq_once_per_bar)
    
    if short_wick_condition and short_body_condition and short_wick_percent_condition and short_bearish_candle and not short_trend_condition
        alert("❌ SHORT SETUP FAILED\n" + 
              "Symbol: " + syminfo.ticker + "\n" + 
              "Reason: " + (not ema_bearish ? "EMA trend bullish" : "EMA trend not consistent") + "\n" + 
              "EMA12: " + str.tostring(ema12, "#.####") + "\n" + 
              "EMA21: " + str.tostring(ema21, "#.####") + "\n" + 
              "Time: " + str.tostring(time), alert.freq_once_per_bar)
bgcolor(long_setup ? color.new(color.green, 90) : na, title="Long Setup")
bgcolor(short_setup ? color.new(color.red, 90) : na, title="Short Setup")
// Show when previous close condition fails
bgcolor(long_wick_condition and long_body_condition and long_wick_percent_condition and long_bullish_candle and long_trend_condition and prev_close_below_lower_band ? color.new(color.orange, 95) : na, title="Long Rejected by Prev Close")
bgcolor(short_wick_condition and short_body_condition and short_wick_percent_condition and short_bearish_candle and short_trend_condition and prev_close_above_upper_band ? color.new(color.orange, 95) : na, title="Short Rejected by Prev Close")

// Detailed debugging for failed conditions
long_all_conditions_except_prev = long_wick_condition and long_body_condition and long_wick_percent_condition and long_bullish_candle and long_trend_condition and long_close_above_bands
bgcolor(long_all_conditions_except_prev and prev_close_below_lower_band ? color.new(color.purple, 90) : na, title="Long Failed: Prev Close Below Band")
bgcolor(long_wick_condition and not long_body_condition ? color.new(color.yellow, 90) : na, title="Long Failed: Body Too Small")
bgcolor(long_wick_condition and long_body_condition and not long_wick_percent_condition ? color.new(color.blue, 90) : na, title="Long Failed: Upper Wick Too Big")
bgcolor(long_wick_condition and long_body_condition and long_wick_percent_condition and not long_bullish_candle ? color.new(color.gray, 90) : na, title="Long Failed: Not Bullish Candle")
bgcolor(long_wick_condition and long_body_condition and long_wick_percent_condition and long_bullish_candle and ema_bullish and not ema_bullish_consistent ? color.new(color.fuchsia, 90) : na, title="Long Failed: Trend Not Consistent")
bgcolor(long_wick_condition and long_body_condition and long_wick_percent_condition and long_bullish_candle and not ema_bullish ? color.new(color.maroon, 90) : na, title="Long Failed: EMA Trend Bearish")
bgcolor(long_wick_condition and long_body_condition and long_wick_percent_condition and long_bullish_candle and long_trend_condition and not long_close_above_bands ? color.new(color.lime, 90) : na, title="Long Failed: Close Not Above Bands")

// Similar debugging for shorts
short_all_conditions_except_prev = short_wick_condition and short_body_condition and short_wick_percent_condition and short_bearish_candle and short_trend_condition and short_close_below_bands
bgcolor(short_all_conditions_except_prev and prev_close_above_upper_band ? color.new(color.purple, 90) : na, title="Short Failed: Prev Close Above Band")
bgcolor(short_wick_condition and short_body_condition and short_wick_percent_condition and short_bearish_candle and short_trend_condition and not short_close_below_bands ? color.new(color.aqua, 90) : na, title="Short Failed: Close Not Below Bands")

// Enhanced table for debugging
if barstate.islast
    var table debug_table = table.new(position.top_right, 2, 19, bgcolor=color.white, border_width=1)
    table.cell(debug_table, 0, 0, "Condition", text_color=color.black, bgcolor=color.gray)
    table.cell(debug_table, 1, 0, "Value", text_color=color.black, bgcolor=color.gray)
    table.cell(debug_table, 0, 1, "Body Size", text_color=color.black)
    table.cell(debug_table, 1, 1, str.tostring(body_size, "#.##"), text_color=color.black)
    table.cell(debug_table, 0, 2, "Upper Wick", text_color=color.black)
    table.cell(debug_table, 1, 2, str.tostring(upper_wick, "#.##"), text_color=color.black)
    table.cell(debug_table, 0, 3, "Lower Wick", text_color=color.black)
    table.cell(debug_table, 1, 3, str.tostring(lower_wick, "#.##"), text_color=color.black)
    table.cell(debug_table, 0, 4, "Upper Wick %", text_color=color.black)
    table.cell(debug_table, 1, 4, str.tostring(upper_wick_percent, "#.##") + "%", text_color=color.black)
    table.cell(debug_table, 0, 5, "Lower Wick %", text_color=color.black)
    table.cell(debug_table, 1, 5, str.tostring(lower_wick_percent, "#.##") + "%", text_color=color.black)
    table.cell(debug_table, 0, 6, "EMA Upper", text_color=color.black)
    table.cell(debug_table, 1, 6, str.tostring(ema_upper, "#.##"), text_color=color.black)
    table.cell(debug_table, 0, 7, "EMA Lower", text_color=color.black)
    table.cell(debug_table, 1, 7, str.tostring(ema_lower, "#.##"), text_color=color.black)
    table.cell(debug_table, 0, 8, "R:R Ratio", text_color=color.black)
    table.cell(debug_table, 1, 8, str.tostring(risk_reward_ratio, "#.##") + "R", text_color=color.black)
    table.cell(debug_table, 0, 9, "Position", text_color=color.black)
    table.cell(debug_table, 1, 9, strategy.position_size > 0 ? "LONG" : strategy.position_size < 0 ? "SHORT" : "NONE", text_color=color.black)
    // NEW DEBUG INFO
    table.cell(debug_table, 0, 10, "Prev Close", text_color=color.black)
    table.cell(debug_table, 1, 10, str.tostring(close[1], "#.##"), text_color=color.black)
    table.cell(debug_table, 0, 11, "Prev Above Upper", text_color=color.black)
    table.cell(debug_table, 1, 11, prev_close_above_upper_band ? "YES" : "NO", text_color=color.black)
    table.cell(debug_table, 0, 12, "Prev Below Lower", text_color=color.black)
    table.cell(debug_table, 1, 12, prev_close_below_lower_band ? "YES" : "NO", text_color=color.black)
    table.cell(debug_table, 0, 13, "Prev Within Bands", text_color=color.black)
    table.cell(debug_table, 1, 13, prev_close_within_bands ? "YES" : "NO", text_color=color.black)
    // NEW: Trend consistency info
    table.cell(debug_table, 0, 14, "Bullish Consistent", text_color=color.black)
    table.cell(debug_table, 1, 14, ema_bullish_consistent ? "YES" : "NO", text_color=color.black)
    table.cell(debug_table, 0, 15, "Bearish Consistent", text_color=color.black)
    table.cell(debug_table, 1, 15, ema_bearish_consistent ? "YES" : "NO", text_color=color.black)
    table.cell(debug_table, 0, 16, "Consistency Bars", text_color=color.black)
    table.cell(debug_table, 1, 16, str.tostring(trend_consistency_bars), text_color=color.black)
    // NEW: Close position relative to bands
    table.cell(debug_table, 0, 17, "Close Above Upper", text_color=color.black)
    table.cell(debug_table, 1, 17, close > ema_upper ? "YES" : "NO", text_color=color.black)
    table.cell(debug_table, 0, 18, "Close Below Lower", text_color=color.black)
    table.cell(debug_table, 1, 18, close < ema_lower ? "YES" : "NO", text_color=color.black)