Fortgeschrittene Handelsmustererkennung und dynamische Risikomanagementstrategie

Strategieübersicht
Die Fortgeschrittene Handelssignal-Erkennung mit dynamischem Risikomanagement ist eine quantitative Handelsstrategie, die präzise Engulfing-Pattern-Erkennung mit einem dynamischen Risikomanagementsystem kombiniert. Im Kern der Strategie steht die exakte mathematische Validierung von Engulfing-Patterns im Markt, ergänzt durch den 50-Perioden-Exponential Moving Average (EMA) als Trendfilter, um sicherzustellen, dass die Handelsrichtung mit dem vorherrschenden Markttrend übereinstimmt. Die Strategie analysiert mehrere technische Indikatoren wie Candlestick-Formationen, Volumenbestätigung und Volatilitätsfilter, um Handelssignale mit hoher Wahrscheinlichkeit zu identifizieren. Gleichzeitig werden dynamische Stop-Loss- und Take-Profit-Ziele auf Basis von Fibonacci-Leveln implementiert, um ein intelligentes Risikomanagement zu ermöglichen.
Funktionsweise der Strategie
Die Strategie basiert auf dem Zusammenspiel mehrerer Kernkomponenten:
-
Trendidentifikationssystem: Der 50-Perioden-EMA dient als primärer Trendindikator. Befindet sich der Kurs oberhalb des EMA, wird ein Aufwärtstrend erkannt (Long-Signale); unterhalb des EMA ein Abwärtstrend (Short-Signale). Dadurch wird sichergestellt, dass Trades stets in Richtung des übergeordneten Markttrends ausgeführt werden.
-
Fortgeschrittene Engulfing-Pattern-Erkennung: Die Strategie erkennt eine erweiterte Version des Engulfing-Patterns, bei dem die aktuelle Kerze die vorherige vollständig „verschlingt". Die Qualität des Patterns wird mathematisch validiert durch:
- Verhältnis der Körpergröße der aktuellen Kerze zur vorherigen (Mindest-Engulfing-Ratio)
- Verhältnis von Schatten zu Körper (maximale Schatten-Ratio)
- Größe der aktuellen Kerze im Verhältnis zum Average True Range (ATR)
-
Mehrstufige Filtermechanismen:
- Volumenfilter: Stellt sicher, dass das Handelsvolumen ein bestimmtes Vielfaches des Durchschnitts überschreitet.
- Volatilitätsfilter: Bestätigt durch ATR, dass die Marktvolatilität geeignete Handelsbedingungen bietet.
- Schattenqualitätskontrolle: Begrenzt die Größe der oberen/unteren Schatten, um die Signalqualität zu erhöhen.
-
Dynamisches Risikomanagement:
- Stop-Loss-Berechnung: Unterstützt mehrere Stop-Loss-Strategien auf Basis von Fibonacci-Leveln, festen Beträgen oder ATR-Multiplikatoren.
- Take-Profit-Ziele: Können über ein festes Risiko-Ertrags-Verhältnis oder Fibonacci-Level definiert werden.
- Automatische Berechnung von Transaktionskosten zur Sicherstellung der Praxistauglichkeit.
Strategievorteile
Die detaillierte Code-Analyse zeigt folgende wesentliche Vorteile:
-
Präziser Einstiegszeitpunkt: Durch die Kombination von Trend, Pattern und mehreren Bestätigungsindikatoren identifiziert die Strategie hochwertige Einstiegspunkte mit statistischem Vorteil und vermeidet Fehlsignale einzelner Indikatoren.
-
Adaptives Risikomanagement: Anders als traditionelle Strategien mit festen Parametern passt sich das Risikomanagement dynamisch an die aktuellen Marktbedingungen an, indem Fibonacci-Level oder ATR-Werte für Stop-Loss und Take-Profit verwendet werden.
-
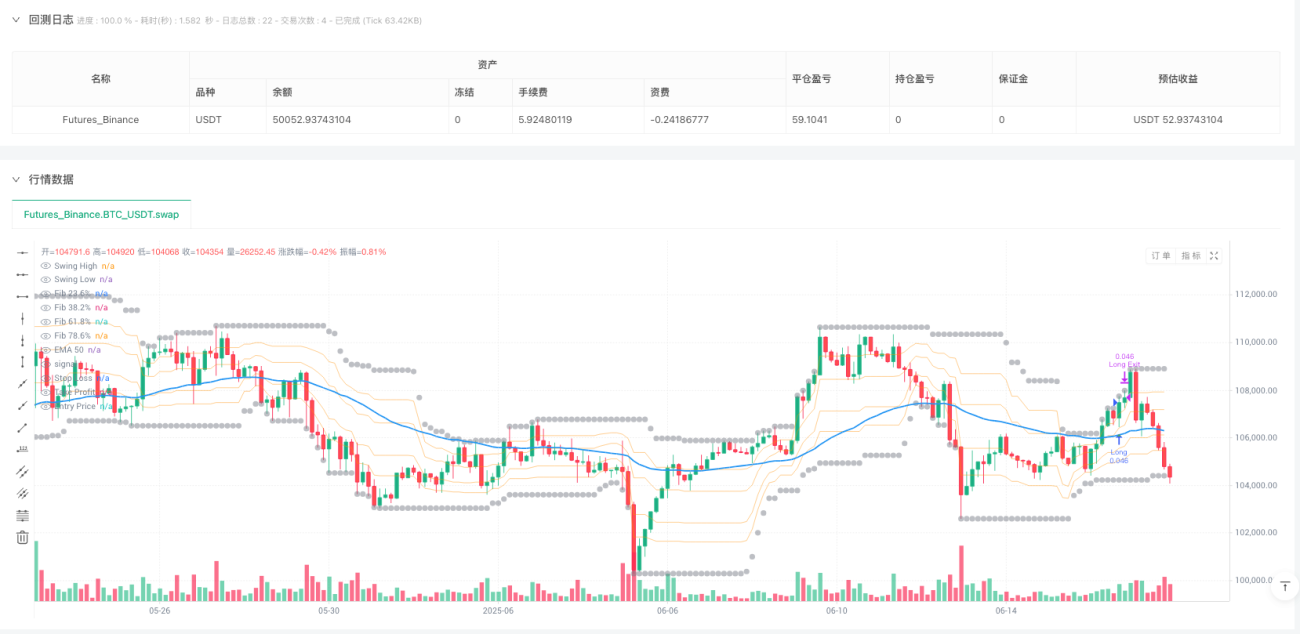
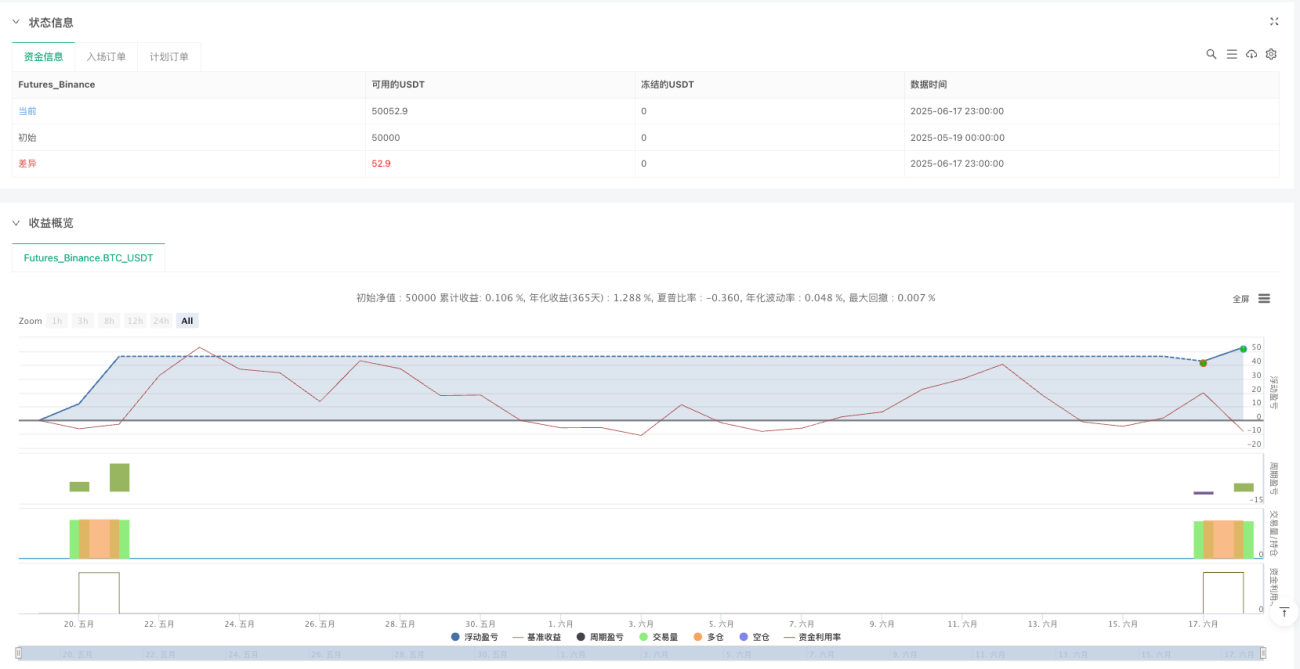
Umfassende visuelle Unterstützung: Die Strategie bietet vollständige Chart-Markierungen und Informationspanels, einschließlich Einstiegssignalen, Stop-Loss/Take-Profit-Niveaus, aktuellem Trendstatus und Echtzeit-P&L-Verfolgung.
-
Hohe Anpassbarkeit: Die Strategie bietet zahlreiche Parameter (EMA-Länge, Engulfing-Ratio, Risiko-Ertrags-Verhältnis usw.), die an individuelle Risikopräferenzen und unterschiedliche Marktbedingungen angepasst werden können.
-
Berücksichtigung von Transaktionskosten: Die integrierte Berechnung der Handelskommission – ein oft übersehener, aber wichtiger Faktor – sorgt für realitätsnahe Backtest-Ergebnisse.
Strategierisiken
Trotz der Vorteile bestehen folgende potenzielle Risiken und Einschränkungen:
-
Abhängigkeit vom Marktumfeld: Die Strategie funktioniert am besten in trendstarken Märkten, kann aber in Seitwärtsbewegungen oder richtungslosen Phasen mit hoher Volatilität mehr Fehlsignale erzeugen. Lösung: Vor der Nutzung sollte der Marktzustand auf höheren Zeitrahmen bewertet oder ein zusätzlicher Marktstrukturfilter integriert werden.
-
Überoptimierungsfalle: Eine übermäßige Optimierung der Parameter kann zu Kurvenanpassung führen und die Performance in zukünftigen Märkten beeinträchtigen. Empfohlen werden Forward-Tests oder Robustheitstests unter verschiedenen Marktbedingungen.
-
Durchbruch des Stop-Loss: Bei extremen Marktbewegungen oder geringer Liquidität kann der tatsächliche Stop-Loss durch Slippage überschritten werden. Dies kann durch einen Stop-Loss-Puffer oder konservativere Positionsgrößen reduziert werden.
-
Nachlaufende technische Indikatoren: EMA und andere Indikatoren sind inhärent nachlaufend und können bei schnellen Marktdrehern zu spät reagieren. Eine Kombination mit höheren Zeitrahmen oder Frühwarnindikatoren kann dies ausgleichen.
-
Qualität des Volumens: Die Strategie berücksichtigt nur die Volumengröße, nicht aber die Struktur oder Qualität des Volumens. Eine zusätzliche Volumenverteilungsanalyse oder Geldflussindikatoren könnten die Tiefe der Analyse erhöhen.
Optimierungsmöglichkeiten
Basierend auf der Code-Analyse ergeben sich folgende Optimierungsrichtungen:
-
Marktzustandsadaptivität:
- Implementierung einer Marktstrukturerkennung, um in Trend- und Seitwärtsmärkten unterschiedliche Parametersets zu verwenden.
- Einbindung eines Volatilitätsindex (VIX) oder anderer Stimmungsindikatoren, um Risikoparameter bei hoher Volatilität automatisch anzupassen.
- Grund: Dadurch kann die Strategie intelligent auf verschiedene Marktumgebungen reagieren und die Gesamtstabilität verbessern.
-
Multi-Timeframe-Analyse:
- Einbindung einer Trendbestätigung aus höheren Zeitrahmen.
- Nutzung niedrigerer Zeitrahmen zur Optimierung des Einstiegszeitpunkts.
- Grund: Multi-Timeframe-Analyse erhöht die Genauigkeit der Trendidentifikation und reduziert konträre Trades.
-
Fortgeschrittene Volumenanalyse:
- Einführung des Volume-Weighted Moving Average (VWMA) als zusätzliche Trendbestätigung.
- Analyse von Kauf- vs. Verkaufsdruck statt nur des Gesamtvolumens.
- Grund: Eine detailliertere Volumenanalyse liefert tiefere Einblicke in das Verhalten der Marktteilnehmer.
-
Machine-Learning-Verbesserung:
- Automatische Parameteroptimierung mittels einfacher ML-Algorithmen.
- Identifikation optimaler Engulfing-Pattern-Merkmale auf Basis historischer Daten.
- Grund: ML kann subtile Muster und Zusammenhänge erkennen, die für Menschen schwer zu finden sind.
-
Erweitertes Risikomanagement:
- Dynamische Positionsgrößenanpassung basierend auf dem Kontowert.
- Tägliche/wöchentliche/monatliche Risikolimits.
- Implementierung einer Breakeven-Funktion.
- Grund: Fortschrittlicheres Risikomanagement ist die Grundlage für langfristigen Handelserfolg.
Zusammenfassung
Die Fortgeschrittene Handelssignal-Erkennung mit dynamischem Risikomanagement ist ein sorgfältig entwickeltes Handelssystem, das traditionelle Engulfing-Pattern-Analyse mit modernen quantitativen Methoden zu einem umfassenden Handelsrahmenwerk vereint. Der Hauptvorteil der Strategie liegt in ihrem mehrdimensionalen Signalbestätigungsmechanismus und dem adaptiven Risikomanagementsystem, das eine relativ stabile Performance in unterschiedlichen Marktbedingungen ermöglicht.
Durch den 50-EMA-Trendfilter, die fortgeschrittene Engulfing-Pattern-Erkennung sowie Volumen- und Volatilitätsbestätigung wird die Qualität der Einstiegssignale erheblich gesteigert. Gleichzeitig bieten dynamische Stop-Loss- und Take-Profit-Ziele auf Basis von Fibonacci-Leveln oder ATR-Multiplikatoren eine klare Risiko-Ertrags-Struktur für jeden Trade.
Trotz inhärenter Einschränkungen wie der Abhängigkeit vom Marktumfeld und der Nachlaufzeit technischer Indikatoren kann die Strategie durch die vorgeschlagenen Optimierungen (Marktzustandsadaptivität, Multi-Timeframe-Analyse, ML-Verbesserungen usw.) noch robuster und anpassungsfähiger werden. Für erfahrene Trader ist sie ein professionelles Handelssystem mit umfassenden Funktionen; für Anfänger dient sie als Lernwerkzeug für fortgeschrittene Handelskonzepte und Risikomanagementprinzipien.
/*backtest
start: 2025-05-19 00:00:00
end: 2025-06-18 00:00:00
period: 3h
basePeriod: 3h
exchanges: [{"eid":"Futures_Binance","currency":"BTC_USDT"}]
*/

//@version=6
strategy("🎯 IKODO Engulfing Strategy with Dynamic RR & Commission", shorttitle="IKODO Engulfing Pro", overlay=true, default_qty_type=strategy.percent_of_equity, default_qty_value=10, pyramiding=0, calc_on_every_tick=false, calc_on_order_fills=false, commission_type=strategy.commission.percent, commission_value=0.04)

// ═══════════════════════════════════════════════════════════════════════════════- 1