
Überblick
Der Multi-Faktor-ALMA-ATR Adaptive Trendfolgestrategie ist ein umfassendes Handelssystem, das mehrere technische Indikatoren kombiniert, um Ein- und Ausstiegszeitpunkte zu optimieren. Kern der Strategie ist die Verwendung des ALMA (Arnaud Legoux Moving Average) als primäres Trendbewertungsinstrument, ergänzt durch einen ATR-Volatilitätsfilter, eine RSI-Momentumbestätigung, eine ADX-Trendstärkeprüfung und einen Bollinger-Bänder-Volatilitätskontrollmechanismus. Die Strategie integriert zudem das UT Bot-System, ein auf dem ATR basierendes Trailing-Stop- und Signalsystem, um die Präzision der Handelsausstiege zu verbessern.
Strategieprinzip
Das Kernprinzip der Strategie besteht darin, durch das Zusammenspiel mehrerer technischer Indikatoren nur dann zu handeln, wenn der Trend klar und die Volatilität angemessen ist. Im Einzelnen:
- Verwendung des ALMA als primären Trendindikator, der im Vergleich zu herkömmlichen EMA oder SMA eine glattere und weniger verzögerte Charakteristik aufweist.
- Implementierung eines Volatilitätsfilters: Der ATR-Wert muss über einem festgelegten Mindestschwellenwert liegen, um eine ausreichende Marktvolatilität sicherzustellen.
- Einstiegsbedingungen umfassen: Der Preis liegt über dem EMA50 und dem ALMA9, der RSI ist über dem überverkauften Niveau und größer als 30, der ADX ist größer als 30 (was auf einen starken Trend hindeutet), der Preis liegt unter dem oberen Bollinger-Band, und die Abkühlungsphase ist eingehalten.
- Ausstiegsbedingungen: Der Preis fällt unter den schnellen EMA, oder der auf dem ATR basierende Stop-Loss/Take-Profit wird ausgelöst, oder die zeitbasierte Ausstiegsbedingung wird erfüllt.
- Integration des UT Bot-Systems, das eine auf dem ATR basierende Trailing-Stop-Linie verwendet, um einen zusätzlichen Schutz für die Trades zu bieten.
Die Strategie wendet ein dynamisches Risikomanagement an, bei dem Stop-Loss- und Take-Profit-Niveaus auf Basis des ATR berechnet werden, sodass sich die Strategie an unterschiedliche Volatilitätsbedingungen anpassen kann.
Stärkenanalyse
Die Strategie bietet mehrere signifikante Vorteile:
- Mehrfachbestätigungsmechanismus: Durch die Integration mehrerer technischer Indikatoren (ALMA, RSI, ADX, Bollinger-Bänder usw.) wird die Zuverlässigkeit der Signale erhöht und die Anzahl der Fehlsignale reduziert.
- Hohe Anpassungsfähigkeit: Die dynamischen Stop-Loss- und Take-Profit-Niveaus basierend auf dem ATR ermöglichen es der Strategie, sich an Änderungen der Marktvolatilität anzupassen.
- Effektive Trendidentifikation: Die geringe Verzögerung des ALMA in Kombination mit der Bestätigung der Trendstärke durch den ADX hilft, Trendänderungen rechtzeitig zu erfassen.
- Umfassendes Risikomanagement: Durch den Volatilitätsfilter, dynamische Stopps und die Abkühlungsphase wird ein mehrschichtiger Risikoschutz gewährleistet.
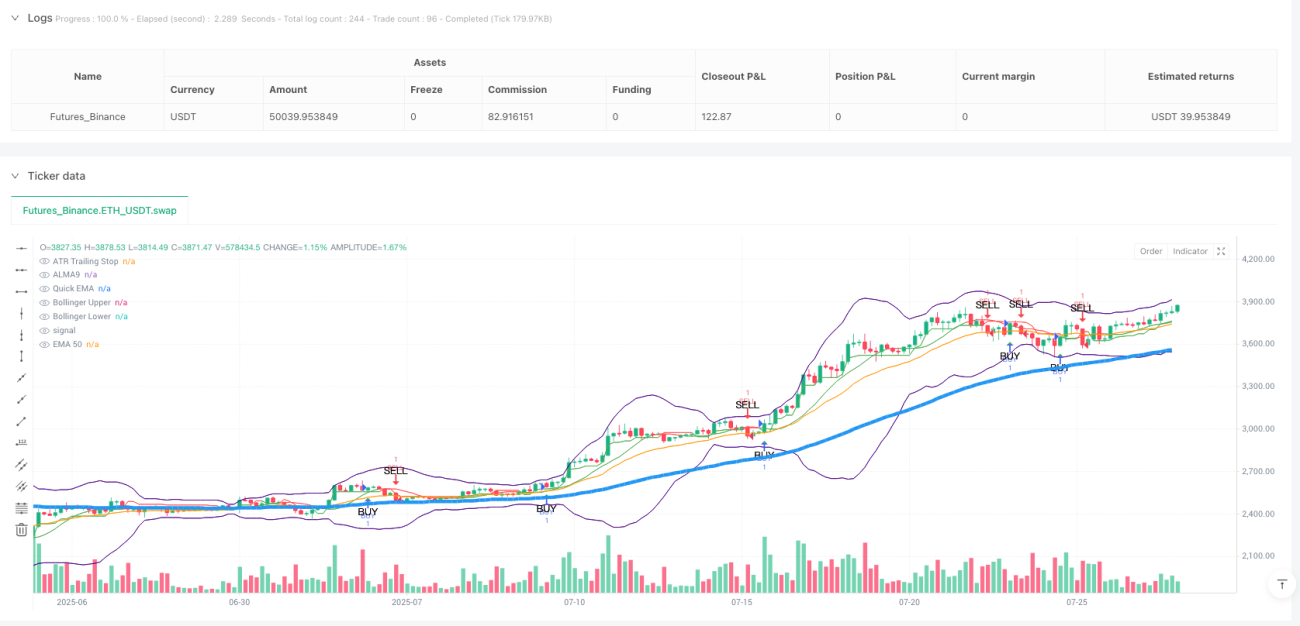
- Klar visualisiert: Die Strategie markiert Kauf- und Verkaufssignale im Chart, sodass Händler die Marktsituation intuitiv verstehen können.
- Hohe Flexibilität: Durch Parametereinstellungen kann die Strategie an verschiedene Marktumgebungen und Handelszeiträume angepasst werden.
Risikoanalyse
Obwohl die Strategie recht ausgereift erscheint, birgt sie dennoch folgende potenzielle Risiken:
- Risiko der Parameteroptimierung: Eine Überoptimierung der Parameter kann dazu führen, dass die Strategie in historischen Daten gut abschneidet, aber im Live-Handel weniger effektiv ist.
Lösung: Verwendung von Forward-Tests und Out-of-Sample-Daten zur Validierung der Robustheit der Parameter. - Risiko von Trendumkehrungen: Bei starken Trendumkehrungen könnte die Strategie nicht schnell genug reagieren, was zu Gewinnrücknahmen führt.
Lösung: Erwägung der Integration von Frühwarnindikatoren für Trendumkehrungen, wie z. B. Momentum-Oszillatoren oder Volumenanalyse. - Risiko von Überhandel: In Seitwärtsmärkten könnten übermäßig viele Handelssignale generiert werden.
Lösung: Verschärfung der Volatilitätsfilterbedingungen oder Aussetzen des Handels nach Identifizierung eines Seitwärtsmarktes. - Risiko von Stop-Loss-Fallen: Der Markt könnte einen Stop-Loss auslösen und dann schnell zum vorherigen Trend zurückkehren.
Lösung: Erwägung einer gestaffelten Stop-Loss-Strategie oder einer dynamischen Anpassung des Stop-Loss-Multiplikators an verschiedene Marktbedingungen. - Verzögerungsrisiko: Obwohl der ALMA eine geringere Verzögerung aufweist, haben alle technischen Indikatoren eine gewisse inhärente Verzögerung.
Lösung: Erwägung der Ergänzung um vorausschauende Indikatoren oder Optimierung der ALMA-Parametereinstellungen.
Optimierungsmöglichkeiten
Basierend auf der Analyse der Strategie werden folgende Optimierungsrichtungen vorgeschlagen:
- Marktzustandsklassifizierung: Einführung eines Mechanismus zur Erkennung des Marktzustands, um in verschiedenen Marktphasen (Trend, Seitwärtsbewegung, hohe Volatilität usw.) unterschiedliche Parametereinstellungen zu verwenden. Dies erhöht die Anpassungsfähigkeit der Strategie in verschiedenen Marktumgebungen.
- Integration von Volumen: Die Einbeziehung von Volumenindikatoren als Hilfsmittel zur Trendbestätigung kann die Zuverlässigkeit der Signale verbessern.
- Multi-Timeframe-Analyse: Einführung eines Multi-Timeframe-Bestätigungsmechanismus, um sicherzustellen, dass die Handelsrichtung mit dem Trend in höheren Zeitrahmen übereinstimmt.
- Optimierung durch maschinelles Lernen: Verwendung von Algorithmen des maschinellen Lernens zur dynamischen Parameteranpassung oder zur Vorhersage optimaler Ein-/Ausstiegspunkte.
- Verbesserung der Take-Profit-Strategie: Implementierung eines gestaffelten Take-Profits oder eines dynamischen Take-Profits basierend auf der Marktstruktur, um die Kapitaleffizienz zu steigern.
- Signalqualitätsbewertung: Entwicklung eines Systems zur Bewertung der Signalqualität, das Trades nur dann ausführt, wenn die Signalstärke einen bestimmten Schwellenwert überschreitet.
- Kontrolloptimierung von Drawdowns: Einführung eines übergeordneten Positionskontrollmechanismus, der die Positionsgröße reduziert oder den Handel pausiert, wenn der Drawdown ein bestimmtes Niveau überschreitet.
Das Ziel dieser Optimierungsrichtungen ist es, die Robustheit der Strategie zu verbessern, Drawdowns zu reduzieren und eine konsistente Leistung in verschiedenen Marktumgebungen sicherzustellen.
Zusammenfassung
Die Multi-Faktor-ALMA-ATR Adaptive Trendfolgestrategie ist ein umfassendes Handelssystem mit gutem Risikomanagement. Durch die Integration mehrerer technischer Werkzeuge wie ALMA, ATR, RSI, ADX, Bollinger-Bänder und UT Bot ist die Strategie in der Lage, Trends effektiv zu identifizieren, Rauschen zu filtern, Risiken zu kontrollieren und zu geeigneten Zeitpunkten einzusteigen und auszusteigen. Der Kernvorteil der Strategie liegt in ihrem mehrfachen Bestätigungsmechanismus und dem adaptiven Risikomanagementsystem, das es ihr ermöglicht, in verschiedenen Marktumgebungen stabile Leistungen zu erbringen.
Dennoch steht jede Handelsstrategie vor den Herausforderungen der Marktunsicherheit. Durch kontinuierliche Optimierung der Parametereinstellungen, Einführung einer Marktzustandsklassifizierung und Integration von Multi-Timeframe-Analysen bietet die Strategie noch erhebliches Verbesserungspotenzial. Für quantitative Trader handelt es sich um eine Strategie mit einem soliden grundlegenden Rahmen, die je nach persönlicher Risikobereitschaft und Marktverständnis weiter angepasst und optimiert werden kann.
- 1