EMA inFusion Pro Mehrquellen-Datenfusionsstrategie

🎯 Strategie-Kern-Highlights: Eine EMA-Strategie, die nicht nur auf den Preis schaut
Wussten Sie? Die meisten Leute verwenden den EMA nur, um den Preis zu betrachten. Aber was macht diese Strategie so besonders? Sie kann den EMA aus 6 verschiedenen Datenquellen berechnen! Wie beim Kochen, wo man nicht nur Salz, sondern auch Zucker, Essig und Sojasauce verwendet, um reichhaltigere Handelssignale zu erhalten.
Wichtig! Diese 6 Datenquellen umfassen: den normalen Preis, das Volumen, die Veränderungsrate, den durchschnittlichen Kerzenpreis, das durchschnittliche Kerzenvolumen und die durchschnittliche Kerzen-Veränderungsrate. Jede bietet einen anderen Markteinblick!
📊 Dreifaches Filtersystem: Präzisere Signale
Diese Strategie gibt nicht einfach so Signale! Sie hat drei "Sicherheitskontrollen":
Erste: EMA-Trendbestimmung 📈
Wie ein Wetterbericht: Zuerst wird die grundlegende Richtung bestimmt – ob es sonnig oder regnerisch ist.
Zweite: ADX-Stärkefilter 💪
Der ADX ist wie ein Instrument zur Messung der Windstärke. Nur wenn der Trend stark genug ist (Standard: über 25), wird ein Signal ausgegeben. So vermeidet man, in einer Seitwärtsbewegung hin- und hergeschlagen zu werden!
Dritte: Volumenbestätigung 🔊
Ein sprunghafter Anstieg des Volumens ist, als würde die Aktie "laut sprechen", und beweist, dass das Signal ernst gemeint ist – kein Scherz.
🎮 Drei Exit-Modi: An verschiedene Handelsstile anpassbar
Am praktischsten: Die Strategie bietet 3 Exit-Modi, wie bei einem Spiel mit Schwierigkeitsgraden "Einfach", "Normal" und "Schwer":
Modus 1: Exit bei gegensignal 🔄
Am einfachsten: Bei einem Long-Signal wird Short geschlossen und Long geöffnet, bei einem Short-Signal wird Long geschlossen und Short geöffnet.
Modus 2: Dynamischer ATR-Trailing-Stop-Loss/Take-Profit 📏
Passt sich automatisch an die Marktvolatilität an: Bei hoher Volatilität wird der Stop-Loss etwas weiter gesetzt, bei niedriger enger.
Modus 3: Feste prozentuale Stop-Loss/Take-Profit 📊
Am verständlichsten: 2 % Gewinn mitnehmen, 1,5 % Verlust akzeptieren (anpassbar).
🚀 Praktische Anwendungsempfehlungen
Empfohlene Zeitrahmen: Kurz- bis mittelfristiger Handel, besonders geeignet für Märkte mit einer gewissen Volatilität.
Fallstrickvermeidung: Bei Seitwärtsmärkten vorsichtig sein; es wird empfohlen, den ADX-Filter zu aktivieren.
Fortgeschrittene Anwendung: Man kann verschiedene Datenquellen ausprobieren. Die Volumenquelle ist besonders effektiv bei Ausbrüchen mit steigendem Volumen!
Der größte Vorteil dieser Strategie ist ihre hohe Flexibilität: Sie können je nach Marktumfeld die am besten geeignete Datenquelle und Exit-Modus wählen. Denken Sie daran: Es gibt keine perfekte Strategie, sondern nur die Strategie, die am besten zum aktuellen Markt passt!
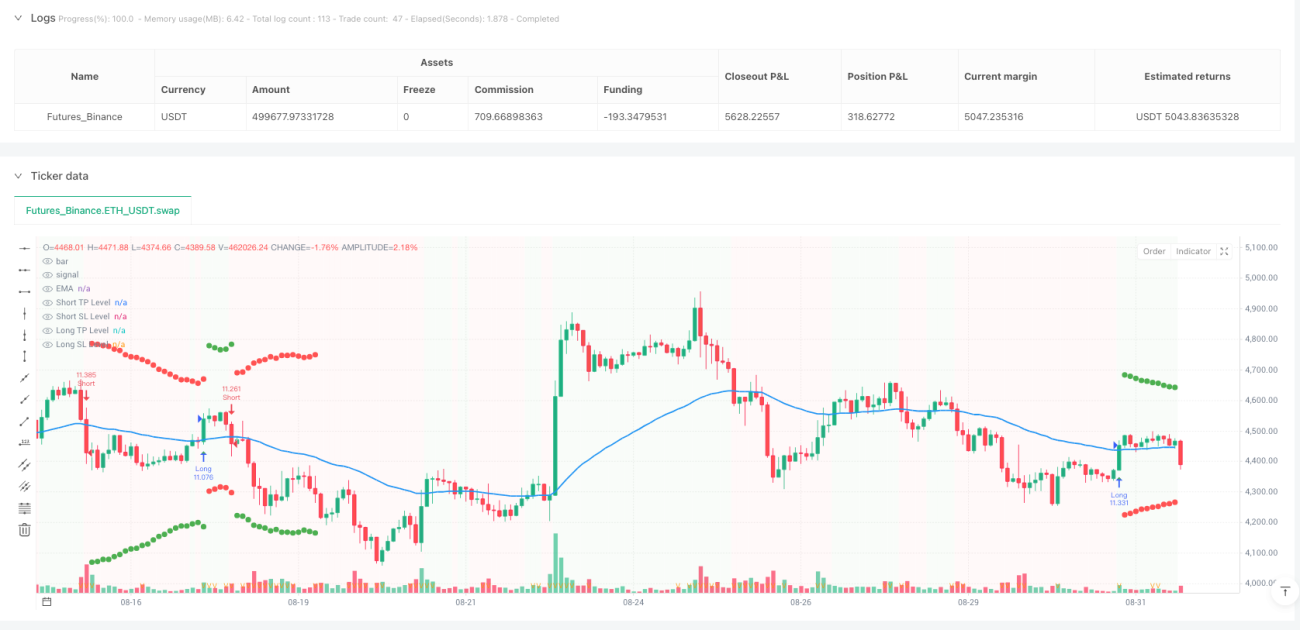
/*backtest
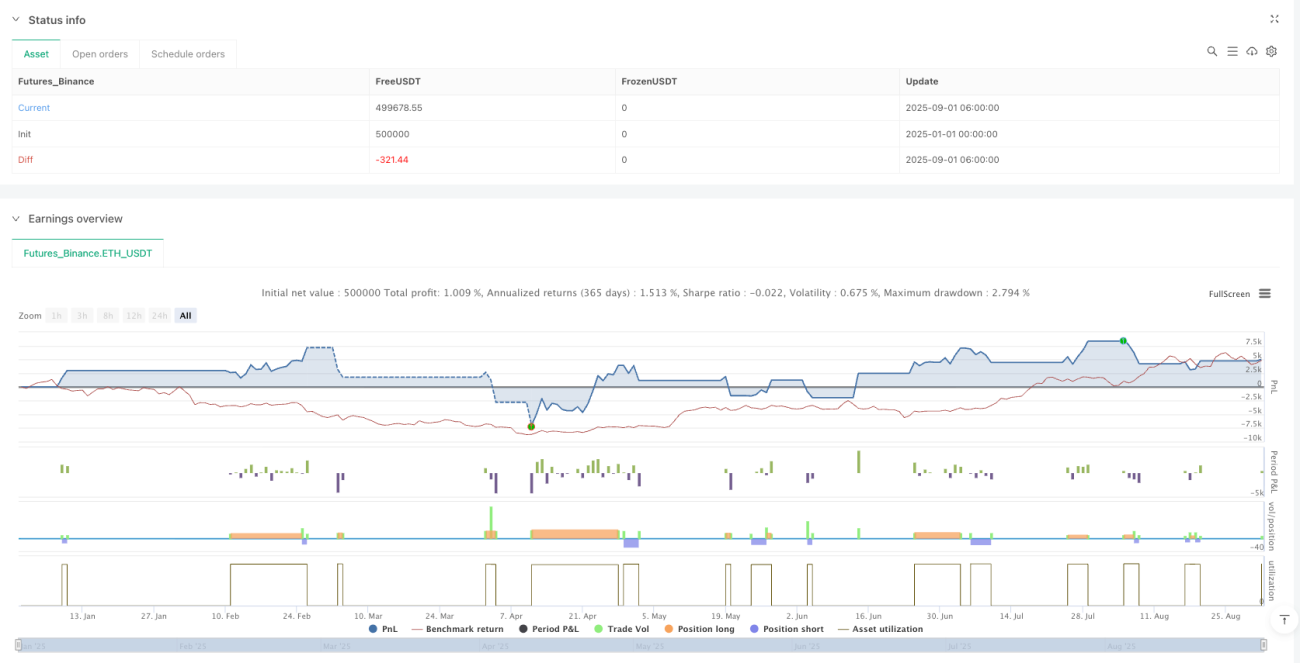
start: 2025-01-01 00:00:00
end: 2025-09-01 08:00:00
period: 2h
basePeriod: 2h
exchanges: [{"eid":"Futures_Binance","currency":"ETH_USDT","balance":500000}]
*/
//@version=5
//@fenyesk
strategy("EMA inFusion Pro - Source Selection", overlay=true, initial_capital=10000, default_qty_type=strategy.percent_of_equity, default_qty_value=10)
- 1