The first, second, third buy, second, third buy, second, third buy, second, third buy, second, third buy, second, third buy, second, third buy, second, third buy, second, third buy, second, third buy, second buy, second buy, second buy, second buy, second buy, second buy, second buy, second buy, second buy, second buy, second buy, second buy, second buy, third buy, third buy, third buy, third buy, third buy, third buy, third buy, third buy, third buy, third buy, third buy, third buy, third buy, third buy, third buy, third buy, third buy, third buy, third buy, third buy, third buy, third buy, third buy, third buy, third buy, third buy, third buy, third buy, third buy, third buy, third buy, third buy, third buy, third buy, third buy, third buy, third buy, third buy, third buy, third buy, third buy, third buy, third buy, third buy, third buy, third buy, third buy, third buy.
Author: The Little Dream, Created: 2017-11-13 10:16:44, Updated: 2017-11-15 17:02:171, 2, 3 How to buy
-
1, the 123 plot refers to: the price breaks through the recent trend line and then falls back, when it again moves in the opposite direction from the original trend, it forms the 123 plot.
The chart below represents a buying chart where the price breaks the apparent downtrend at point A, when the price rises to point B, then falls back to low point C, and starts to rise again, i.e. the chart for the price of 123 cents. -
2, the falling space from 2 to 3 must be at least 0.382 times greater than the magnitude of 1 to 2 points. The buy point is D. If the price does appear to continue to rise, then at point E, additional buying or stop-wins can be considered, since at this point the price breaks through the price of point B, a new trend has formed. The stop-loss can be set at the price breaking through C.
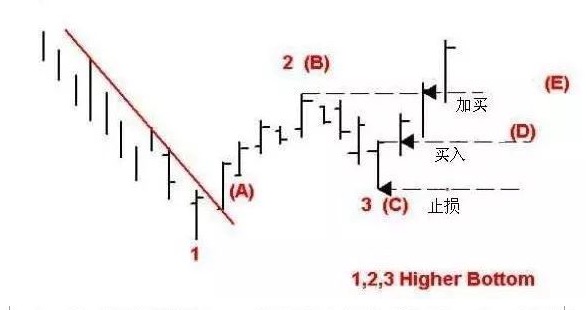
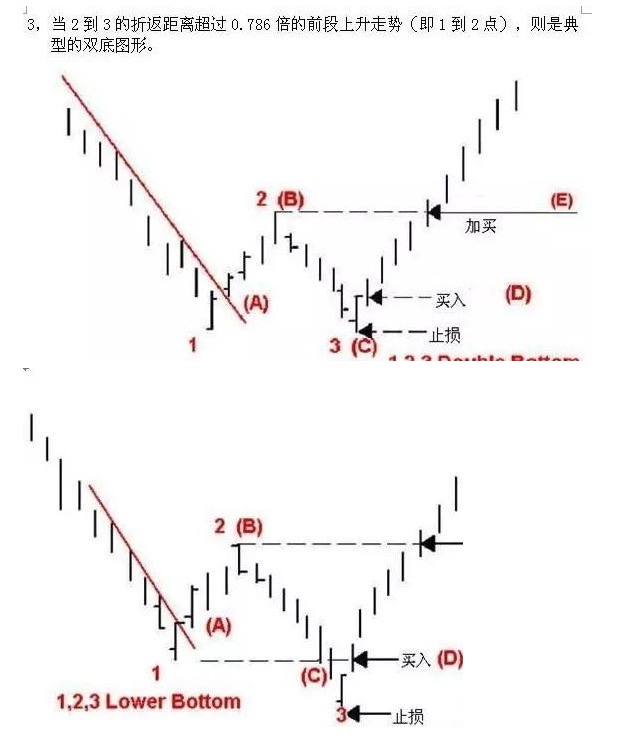
The regularization process is as follows: D point buy, break down the lowest stop loss price at 3 pips, break up E point buy or stop win. The space above D point to E point is at least twice the stop loss space. The risk of return is 2:1, the probability of success is about 65%.
We can use the formula above: average profitability per trade = probability of success.Rate of returnR is the probability of failureR (R = risk value), which can be calculated as: Average profitability of each trade = probability of successRate of returnR is the probability of failureR (R = risk value) = 65% × 2 × R
35% × R = 0.95 R. Here, R = 3 the space value of the line K. -
2B rule
False breakouts often occur during a trend or turbulent trend. For example, a price that has already crossed a previous high price and failed to continue rising, and then falls below the previous high, the trend is likely to reverse.
-
The 2B rule, a trading strategy specifically designed to deal with fake breakouts. What do you mean? 1, observe the confirmation of the drawback after the breakout, if the price falls after the breakout of the previous high (low), then the position can be opened in reverse at this normalization point. What do you mean? 2, if the market is unfavorable (erroneous directional judgement), break through the normalization point of about 3% stop loss. What do you mean? 3, if the market is favorable (the direction is correct), the profit stops at 6% or more.
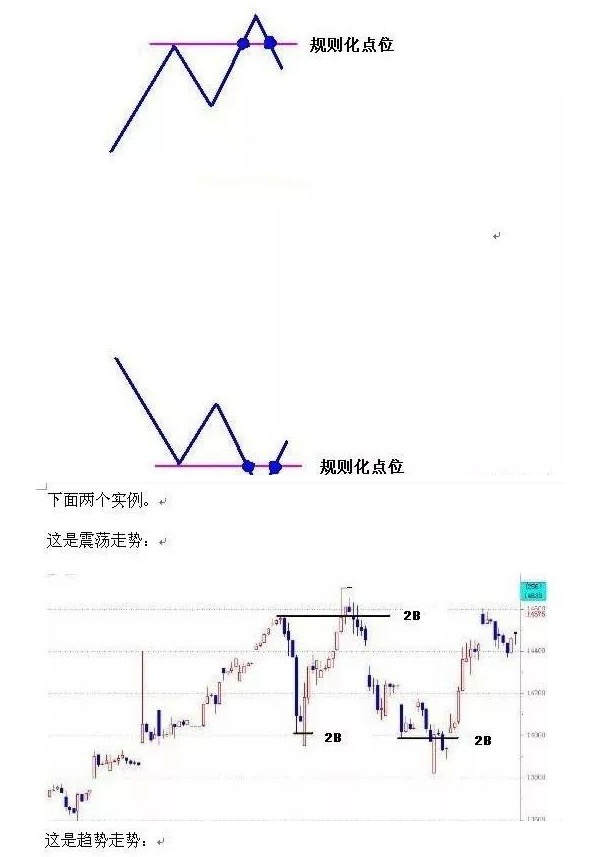 Figure 3
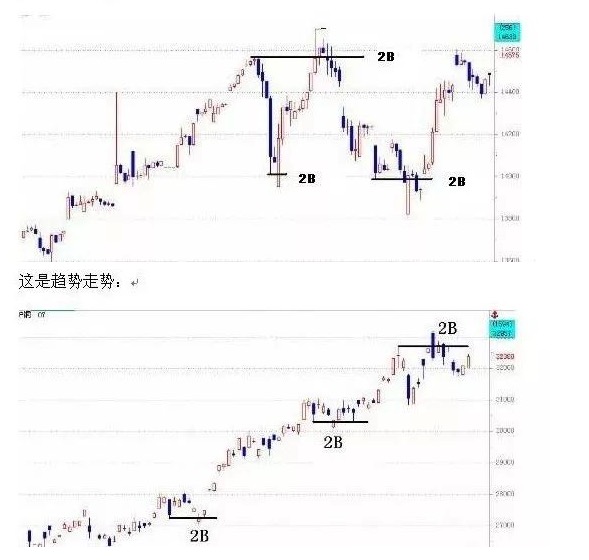 Figure four
This strategy has a risk-return ratio of 2:1 and a 60% probability of winning.
We can use the formula above: average profitability per trade = probability of success.Rate of returnR is the probability of failureR (R = risk value), which can be calculated as:
Average profitability of each trade = probability of successRate of returnR is the probability of failureR (R = risk value) = 60% × 2 × R
Translated from the Zen Library
- Please help tech support to see this error, does not support OKEX trading against LTC_USDT?
- Bitfinex's margin trade is supported?
- SyntaxError: error parsing token (line 1311) The machine suddenly failed to work, it was working for the first two days, what changed?
- Bitcoin trading by using bots
- Fundamental logic and trading strategies behind high volatility
- Trade logs maintained
- OKEX futures cannot be reset before October 30?
- The price of BTC/USDT is so high, why hasn't anyone moved?
- Why do bots that run ZBs report errors?
- Solved // why GetDepth only returns the correct result on the first call and does not change on subsequent calls
- Inventors quantify support for huobi and OKEX coins and USDT transactions?
- Open a withdrawal function that is integrated into the digital currency trading library
- How do you calculate the maximum funding capacity of a strategy by measuring the returns, volatility, etc. of a strategy?
- Shannon’s Demon
- It's not the technology that's complicated, it's the human mind!
- Bitfinex's interface access is slow, what do you guys have recommendations for server placement?
- Bitfinex is running erroneously, help analyze, thank you!
- Please tell me which time point the data retrieved when the API was called is based on?
- The code for the Bitcoin coin.
- Why is there only four pairs of BCH_USD, BTC_USD, ETH_USD, and LTC_USD in bitfinex?