Programmatic transactions break through strategies to get parameters moving
Author: The Little Dream, Created: 2017-12-28 09:29:31, Updated:Programmatic transactions break through strategies to get parameters moving
Many people initially come into contact with programmatic trading by choosing a method of optimizing parameters to select parameters. Gradually, as the trading environment changes, traders often begin to adjust parameters independently. While not all parameters require us to adjust them all the time, this may make the program more flexible if we adjust parameters in our program as the environment changes.
-
Here we give a simple example: the N-day break-through strategy, or in other words, the break-through strategy of the N-root K-bar.
So in which market is it easier to make money with a bullish breakout strategy? It's obviously a big gap in the trend, or most of the bullish markets are easier to make money. But if we encounter a bullish trend, there can be a problem of how many bullish signals are repeated.
So in the field of programmatic trading, what's the problem with this N? We can set N to 5, if the trend is obvious now, then we're going to go in faster. But if the trend is not obvious, then it's very troublesome. So when the trend is obvious, we can make N a little bit smaller.
First, the trend is whether the very obvious determines the size of N. If the trend is obvious, it represents a larger proportion of the index that will fluctuate. On the other hand, if the trend is flat, it represents the index that will be organized within a certain range, that is, the fluctuation will be relatively small. Therefore, fluctuation is key in determining the size of N.
If we set N to 20, we can calculate the standard deviation of 20 K-bars, which we can call V20. If we want to measure it in a short time, let's say we use 10 K-bars and calculate the standard deviation of 10 K-bars, let's say V10.
-
The strategic principles for breaking through the N-space:
Suppose that today's high price breaks the high of the previous N days and is bought at the time of the last N days' high and sold at the time of today's low falling to the low of the previous N days. This strategy is more applicable to commodities with a clear trend, especially unilateral commodities.
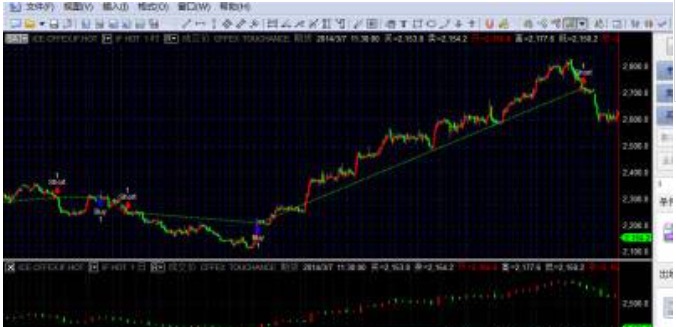
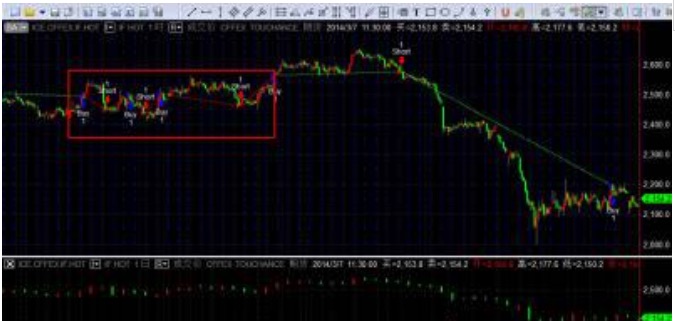
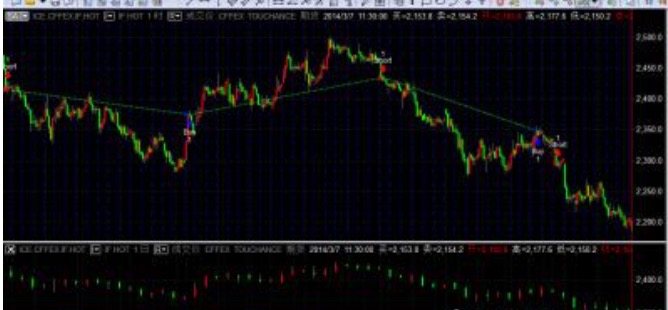
The test commodity stock index IF, using two charts, sub-chart 1 cycle 1 hour, sub-chart 2 cycle 1 day; source code as follows:
inputs: x(20),y(10) ; //定义波动率参数 Vars: V20(10),V10(10),N2(10),N1(10),N(10); //定义变量 V20=Volatility(x)of data2; V10=Volatility(y)of data2; //定义波动率取日线数据,取子图2的日线线数。这个Volatility函数是分别取20日跟10日ATR的移动平均数值 if V10<>0 and N2<>0 then begin N1=(N*V20)/V10; //定义N1的值,前提让分母不为0时执行, //这N1=(N*V20)/V10是此参数自动化的核心, 代表你将原本固定N天的参考值改成会/根据V20和V10而变动的N1值, V20是较长期的,而V10是近期,大家看到这个公式应该可以发现,当你近期的波动率变大时,表示趋势出现,你的N1就会变小,而近期的波动率变得越小时,表示在盘整,N1就会变大,这样新的N变化似乎比较合理一点。 N2=IntPortion(N1); //给N1取整赋值给N2 end; value1=Average(high of data2,N2)of data2; value2=Average(low of data2,N2)of data2; //定义前N2天的高点跟低点的值给value1和value2 if close crosses above value1 then begin buy next bar at market; end; //当价格上穿高点时买入或者反向 if close crosses below value2 then begin sellshort next bar at market; end; //当价格下穿低点时开空或者反向 -
The strategy loads the demo:
This is all we have to tell you about breakthrough strategy parameters automation, and we hope you will learn and discuss with us!
- Bittrex has raised questions, asking for advice
- The platform supports EOS-BTC?
- ZB has been slowing down the speed of the query!
- What are the methods to solve this problem?
- How can I find out the price of a coin in my personal account, or the history of every successful purchase and sale?
- I'm a white boy, please tell me how to create a trustee
- How do you get all the tradable coins on the exchanges?
- C++ strategies for writing knowledge points C++ memory recovery
- Set the policy interface parameters
- Try{}catch(...) {} in c++ is not working.
- How to delete past logs
- Basic built-in data types of the C++11 standard
- Sublime Text is often used as a shortcut (MAC)
- The stock market retrospective only leaves the data for November and December?
- Is there a detailed description of the specific algorithms for the various indicators of TA?
- How can you do this without refreshing the chart after restarting the policy?
- Problems with PY2 and PY3
- Inventor quantification supports the use of mobile watch strategies?
- This quantity and price of the c++ version are the same number.
- The exchange.Go))) method is not working, please check the following version of C++
ruiruiN1 = ((N*V20) / V10; how is N defined?