Introduction to the use of FMZ analytics tools (the latest features)
Author: The grass, Created: 2020-03-30 17:39:16, Updated: 2020-04-02 15:35:56Other information
The analysis formula refers to alpha101 published by worldquant:http://q.fmz.com/chart/doc/101_Formulaic_Alphas.pdfThe method of calculating the central market is basically compatible with its syntax (not implemented with explanations) and has been enhanced. This feature can be prepared in advance for future support of stocks and users can try it out.
It is used to quickly perform operations on time sequences and to validate ideas. Use address:https://www.fmz.com/m/alphaThis is the first time I've seen this video.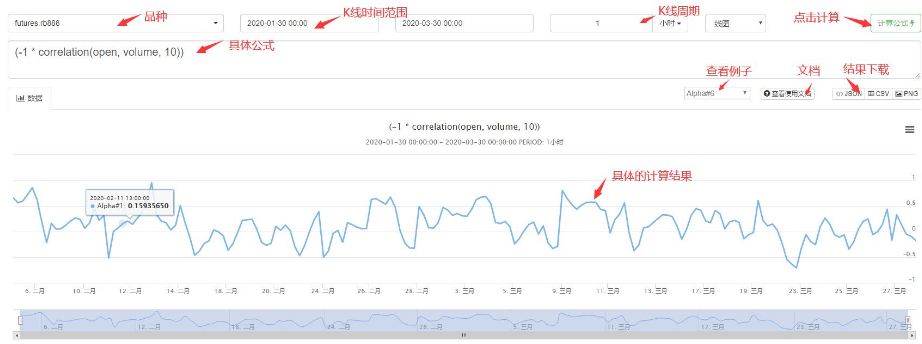
Functions and operators
The lower symbol {} represents the placeholder, all expressions are size-sensitive, and x represents the time sequence of the data
abs(x), log(x), sign(x)The term is also used to refer to a set of functions that are not necessarily equal to each other.
The following operators:+, -, *, /, >, <It's not just about the media.==I'm not sure if it's the same.||I'm not sure what you mean by that.x ? y : zThe third operator is:rank(x): cross-sectional sort, returns the percentage of where it is. It is necessary to specify a pool of multiple parameters for selection, for a single sector cannot be calculated, will return the original result directly.delay(x, d): the value before the d-cycle of the sequence.sma(x, d): a simple equilateral of a sequence d cycles.correlation(x, y, d): the coefficients of the time series x and y over the past d cycles.covariance(x, y, d): time sequence x and y past d cycles are convex.scale(x, a)The data is unified.sum(abs(x))=a(a is assuming 1) ⋅delta(x, d): the current value of the time sequence x minus the value before the period d.signedpower(x, a) : x^a
decay_linear(x, d): time series x with a weighted d-cycle moving average, weighted as d, d-1, d-2...1 ((after unification treatment)).indneutralize(x, g): Neutral treatment for industry classification g, currently not supported.ts_{O}(x, d): perform O operations on the time series x past d cycles (O can represent min, max, etc. in more detail below), and d is converted to an integer.ts_min(x, d): the past d-cycle minimum.ts_max(x, d): the maximum value of the past d cycle.ts_argmax(x, d) : ts_max(x, d)Location.ts_argmin(x, d) : ts_min(x, d)Location.ts_rank(x, d): the ordering of the x-values of the time series over the past d cycles (percentage ordering).min(x, d) : ts_min(x, d)
max(x, d): ts_max(x, d)
sum(x, d): the sum of past d cycles.product(x, d): the product of past d cycles.stddev(x, d): the standard deviation of the past d cycles.
Input data
The size of the input data is not text sensitive, the default data is the selected variety on the web page, or you can specify directly:MA888.closeI'm not sure what you mean by that.
returnsThe closing price yield:open, close, high, low, volumeThe price of the transaction: the opening price, the closing price, the highest price, the lowest price, the volume of transactions during the cycle.vwap: Transaction volume plus transaction price, not realized, currently at closing price.capThe total market value, not realized.IndClassThis is the first time that the project has been implemented.
Other
Supports output of multiple results at once, represented by lists, such as[sma(close, 10), sma(high, 30)]In this case, the user will draw two lines in the diagram.
In addition to inputting time-series data, it can also be used as a simple calculator.
- Please teach me the SetContractType problem
- Please teach the JS custom function problem
- My FMZ quantified path and lightning protection
- How does JS implement non-Log ((() duplicate content
- How did OKEX move from one week to the next?
- How the Futures_binance exchange is moving
- How to display a cross-valued variable in array form
- The strategy of buying a new coin online for a token
- The platform supports real-time quantitative trading of brokered futures.
- Who can help us change it?
- Questions about tokens or tokenized tokens
- Hello everyone, in my language, the linear intersection strategy, can a robot only trade one variety? 10 varieties, you need 10 robots?
- The contracted currency is converted into USDT tokens
- OKex contract switching transaction for error reporting (Javascript)
- How to deal with the issue of hedging, short-term contracts are delivered every Friday at 16:00 pm
- Questions about connecting digital currency exchanges
- How Binance contracts trade
- How does the language of Ma read the four-hour cycle?
- Why Tencent's cloud server can't download hosts
- I used FQ software, a global proxy.