The RSI value calculated using the RSI API and the discrepancy in the token K line chart, please explain why?
Author: fxhover, Created: 2021-01-25 16:07:51, Updated: 2021-01-25 16:08:34As shown in the graph below, the RSI value of the token K Chart 1 hour on 2021-1-23 23:00:00 is 48.08: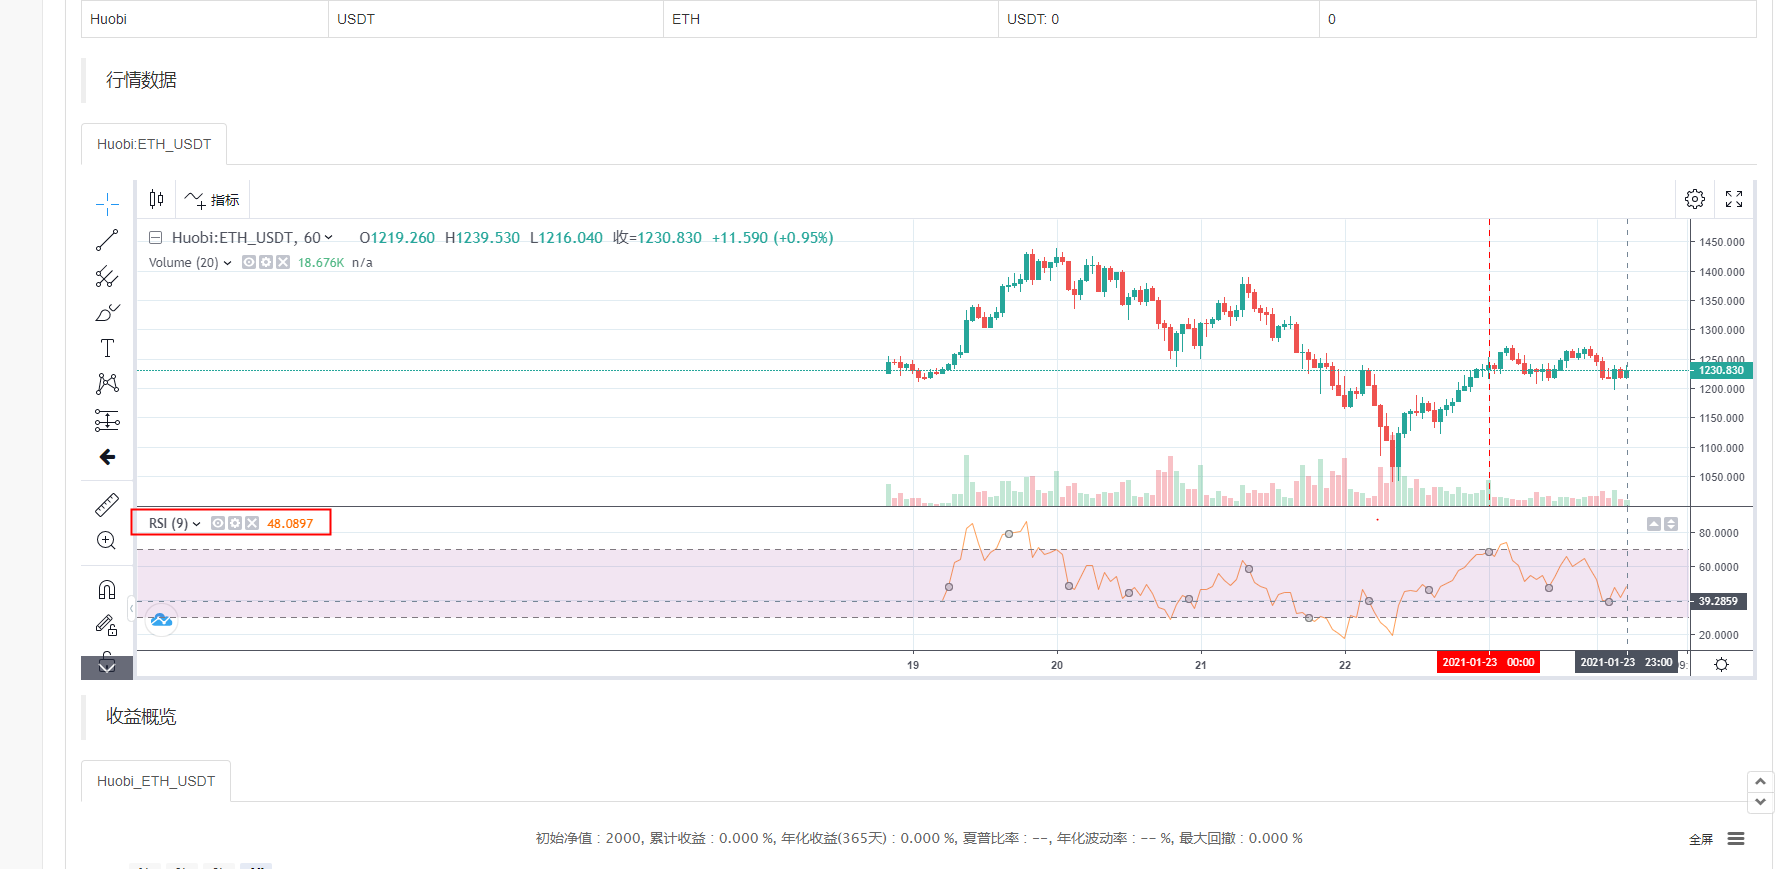
However, the value I calculated using the API is not consistent with the value of the token K string graph, which is calculated as follows:
r is for exchange.GetRecords ((60*60)
rsi = TA.RSI ((r, 9) [-1]
Log ((
2021-1-23 23:00:00 Diary output: 2021-01-23 23:00:00 information rsi: 41.77656327577841
I'm not sure what the reason is.
- How to use the database in the policy (save data)
- What is the K-line cycle option for the robot?
- How to choose when to revise binance
- Help post - Deployment of the host failed
- Bitcoin BTC contracts, how to get more and empty holdings in the current market?
- Makebit brings you a free experience of professional strategy tools, 20 Martingale experience credits, first come, first served.
- For beginners, the EMA indicator can only calculate the EMA of the K line, but not the EMA of other values?
- FMZ supports the BTC-USDT perpetual contract review of the Bitcoin exchange?
- Re-use of files
- Gate.io杠杆借贷市场抢贷脚本(出租)
- Official documentation is not clear enough about the API description
- Newcomers use the tutorial to report mistakes
- Searching for a digital currency quantification strategy
- Search for code
- I'm not sure if you want to be a part of this, or a part of this, or a part of this, or a part of this, or a part of this, or a part of this, or a part of this.
- Please ask about the usage of the Binance API.
- Digital currency futures trading library (test version) What is the use of the specific call?
- 求助,exchange.Buy报错,
- Who has a formula that fits the coin circle?
- Bitcoin money redirect error 404 - where did it go wrong?
The grassI'm not sure if I can use the open source code myself.
The grassThe algorithm of RSI is open source, the parameters are different, the number of cumulative K lines is different, there will be differences.
fxhoverI don't understand, the added platform is tokens.
The grassIt's the API of the platform you're adding.
fxhoverI also found that the data obtained from the K line is not very similar to the data from the tokens, I don't know which platform fmz uses.