Please teach me a drawing classroom problem.
Author: xaifer48, Created: 2022-09-30 22:54:16, Updated: 2022-10-02 21:01:22For example, I draw a line of price changes with ticker [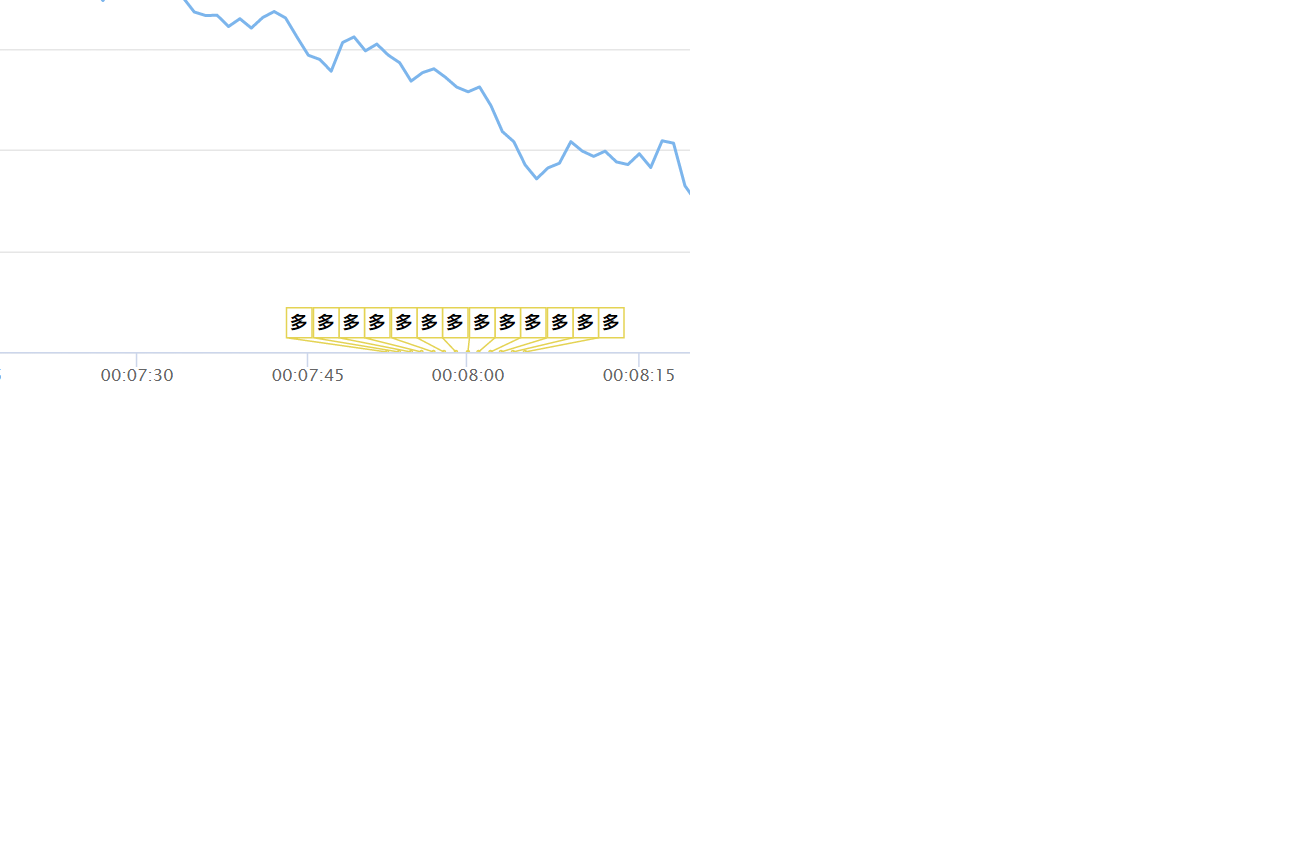
- PINE Language Introductory Tutorial of FMZ Quant
- I need to evaluate the following indicators and make judgments, please tell me how to write a formula that can be used for strategic conditions.
- Please tell me how to calculate the highest price and the lowest price in the historical range. Thank you.
- How should the code on the switch to JavaScript be written on the ok analog disk?
- talib library SAR function calculation results are inconsistent with retested K-line interface
- Please tell me how the table is decorated.
- My experience with quantification
- Can you please provide a tutorial on jsp automatic voting?
- The Mayan language strategy is to use OK exchange to make mistakes.
- How to calculate the re-test fee
- Permanent contracts and storage issues
- Is there any monthly 20-30 Martin Hager idea to arrange with a red card?
- How to buy and sell at the highest point in a minute k line
- pine script variable value problem
- the ema computation problem
- Another new issue is the multi-currency order.
- Ask for help, getDepth data access time frequency and more.
- exchange.SetPrecision ((2, 3) Which of these two fields in a continuous transaction does it play?
- The server automatically updates the Ali Cloud Linux system after using a host error.
- Why can't I do this?
The Little DreamIf you want to draw on a data series, you need to set onSeries. See the main test function in the drawing line library. This is a list of all the different ways PlotFlag is credited in the database. /upload/asset/167ea0ee3c23ca550f22.png I'm not sure what you mean. The text parameter is the content that is displayed when the mouse pauses on this tag, and the title is the content that the tag directly shows on the chart.
xaifer48Received, thank you.
The Little DreamThis is to look for the problem in the code, there must be something wrong. Note the parameter type of the input to the graph function, is it a string or a number.
xaifer48Log (()) prints the parameters for PlotLine, which are all normal output, but without drawing the outline.
The Little DreamIt should not be drawn, specifically printed to check the data below, the parameters of PlotLine.
xaifer48/upload/asset/1494d80683e8660f6dbbf.png This is a list of all the different ways Upload/asset/1494d80683e8660f6dbbf.png is credited in the database. @ChiloChiloM again, please, I want to draw the price in the tick data as an indicator line, the code is like a screenshot. But the tick chart did not respond when I tested it. Is it a code problem? Please guide me, thank you.
The Little DreamI'm not being polite.
xaifer48Good. Thank you.
The Little DreamDepending on the setting of the onSeries property. It is best to set a different ID for each pointer line and then let the tag pass which ID over which one.
xaifer48If you draw multiple indicator lines, will the markings be on the first indicator line by default?
The Little DreamYes, that's what it means.
xaifer48/upload/asset/14946bf09101cd159ff79.png This is a list of all the different ways Upload/asset/14946bf09101cd159ff79.png is credited in the database. Thanks for the guidance. I reworked a drawing line template, added an ID to the drawing line code, and then changed the onionSeries attribute to this ID in the drawing line code, so I can draw a tag on the drawing line.
The Little Dream/upload/asset/17039422114d9cf21ab3.png This is a list of all the different ways Upload/asset/17039422114d9cf21ab3.png is credited in the database. In the source code of this library, the drawing tag is drawn on this property, and the attribute id is the id of the K line, and in the chart above, you see that S is drawn on the K line, and if you want to draw on a line, you set this to onSeries. /upload/asset/16ff6f9bab0cfb16ded4.png This is a list of all the different ways Upload/asset/16ff6f9bab0cfb16ded4.png is credited in the database.
xaifer48PlotFlag ((tick[-1]["Time"), "lastprice","more"), I wrote it this way, the output of the graph is like the screenshot above.